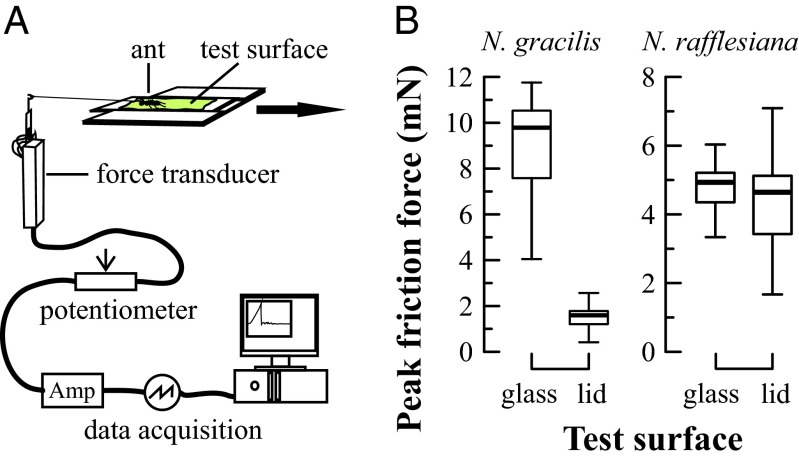
Fig. 4.
Ant friction forces on pitcher lid surfaces. (A) Experimental setup. (B) Peak friction forces generated by Crematogaster ants on the lower lid surfaces of N. gracilis (n = 3) and N. rafflesiana (n = 2) pitchers in comparison with control surfaces (glass). Bars denote medians, boxes represent the inner two quartiles, and whiskers contain all values within 1.5 times interquartile range. For statistics see text.

