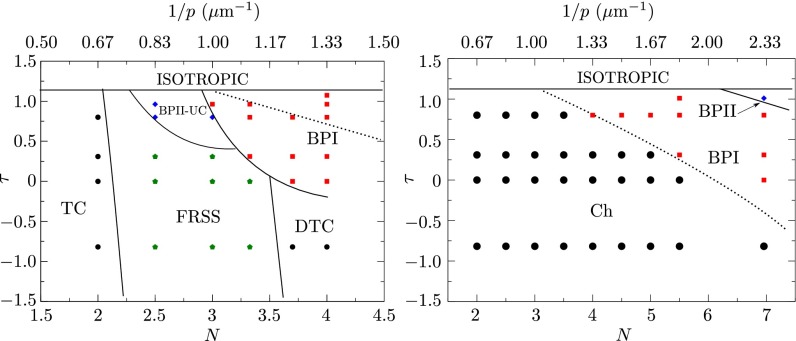
Fig. 1.
(Left) Simulated phase diagram of CμDP with weak planar degenerate anchoring. The morphologies found in the diagram include the twist cylinder (A), the FRSS (B), the deformed twist cylinder (DTC) (C), BPI (E) and blue phase II-unit cell (D). See caption to Fig. 2 for definition of different morphologies and their schematic representation. The solid lines are drawn to delineate the boundaries between different phases. The dotted line divides the cholesteric and BPI regions in the bulk for a system with the same parameters used in this work. (Right) Phase diagram of the bulk behavior where N is the number of π turns of the director over a distance equal to the droplet’s diameter.

