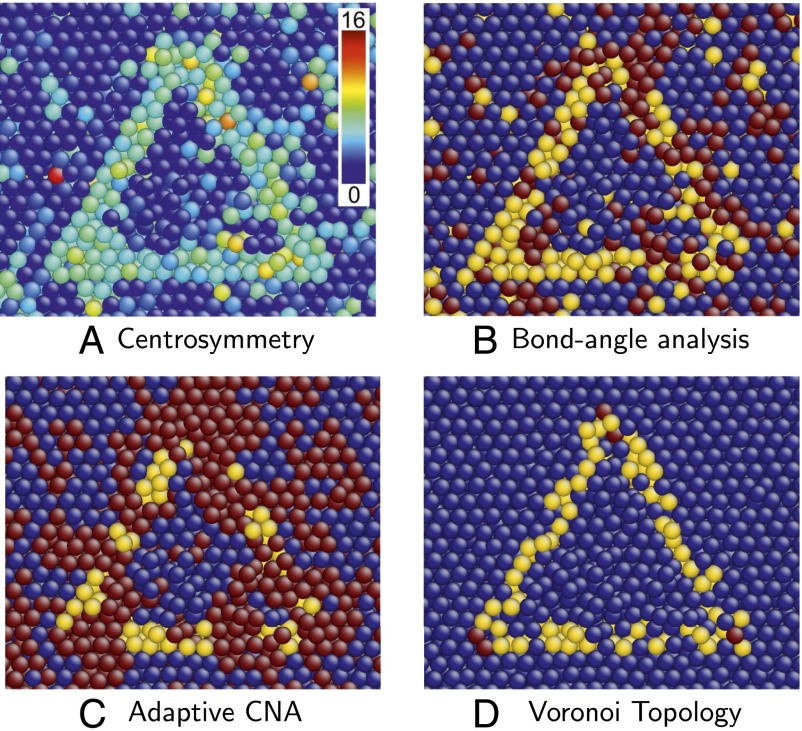
Fig. 6.
Cross-section of an SFT in copper at 85% of its melting temperature, colored using several popular visualization approaches, and the proposed one. In B and C, dark blue, yellow, and red indicate atoms in FCC, HCP, and other local environments, respectively. In D, dark blue, yellow, and red indicate atoms that are FCC types, HCP but not FCC types, and all other types, respectively. (A) CS. (B) Bond angle analysis. (C) Adaptive common-neighbor analysis (CNA). (D) Voronoi topology.

