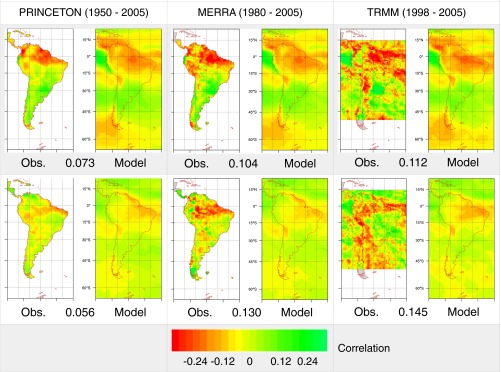
Fig. 1.

Correlation coefficients between monthly SST anomalies in the Niño 3.4 region (Top) or the region in the North Atlantic identified by Yoon and Zeng (29) (Bottom) and local precipitation anomalies. In each panel, the left-hand map shows the observed correlation, based on HadISST monthly SSTs and one of three observed precipitation datasets, indicated above Top; the right-hand map shows the multimodel mean correlation based on CMIP5 results for the same period. The number at the bottom of each panel is the RMS difference between the simulated field of coefficients and that based on observations, calculated over the Amazon basin. The outline of the basin is visible in Fig. 2.
