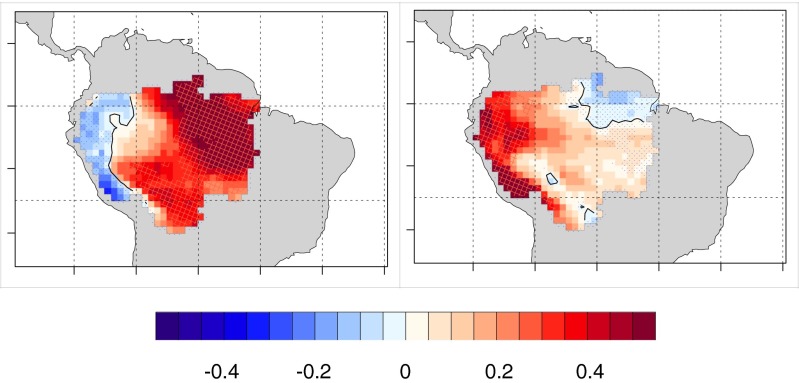
Fig. 5.
Linear trends in number of months per year experiencing drought or unusual wetness, 1950–2099. (Left) Months per year experiencing SPI < −2 and (Right) months per year experiencing SPI > 2. Shown are the mean of results from 35 CMIP5 models. The black line denotes zero trend; i.e., it separates regions of increasing and decreasing drought frequency. Hatching (dots) indicate regions where >2/3 of models have a positive (negative) trend. Units are months per year per century.

