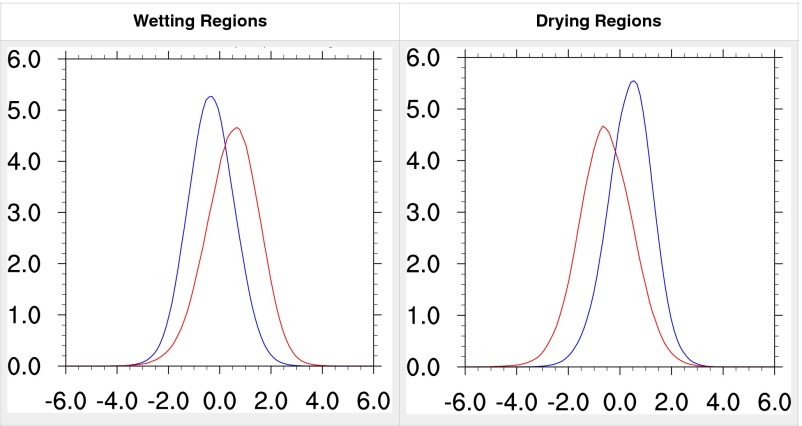
Fig. 6.
Probability density functions of simulated 12-mo SPI values, in regions where annual mean precipitation is projected to increase (Left) and decrease (Right). These regions are shown in Fig. 2. In both “wetting” and “drying” regions, interannual variability in precipitation, as measured by the variance of 12-mo SPI, is projected to increase. Red curve, results for 2071–2100; blue curves, results for 1950–1979.

