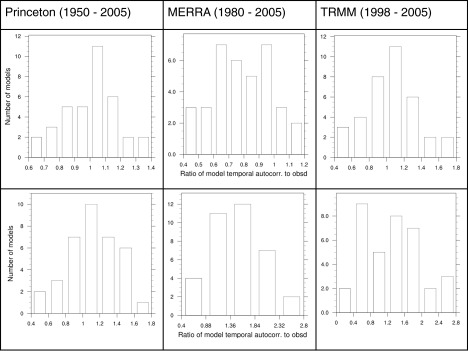
Fig. S4.

Evaluation of the duration of Amazon drought, in CMIP5 simulations, based on the autocorrelation of SPI at lag 6 mo. The ratio of this measure in each model to its value in each observational data was found, and the histograms illustrate how many models have various values of this ratio. (Top) The 12-mo SPI < −1 and (Bottom) 12-mo SPI < −2. Different columns show comparison of models to different observation-based datasets.
