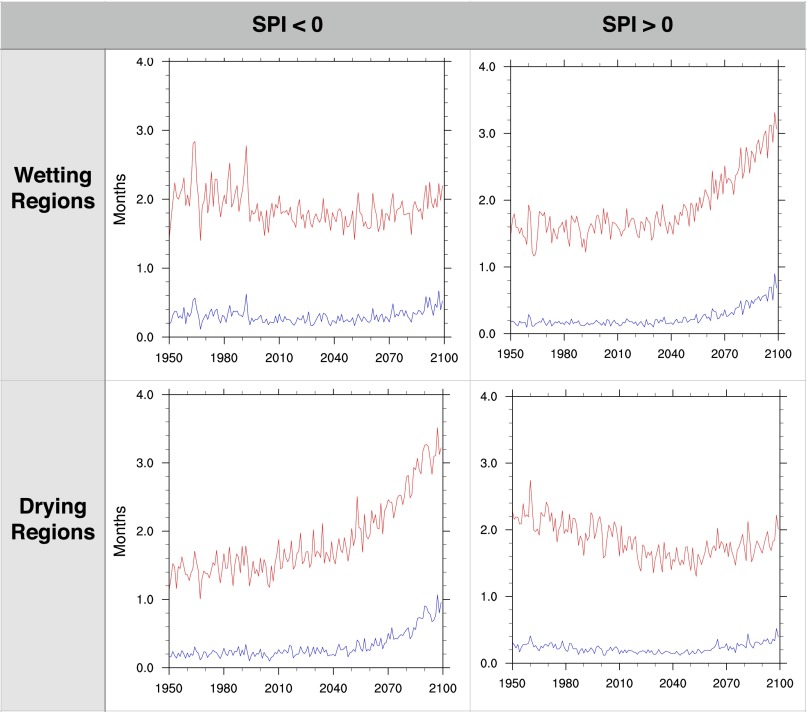
Fig. S9.
Same as Fig. 7 except showing results for 3-mo SPI. Simulated frequency of drought or unusual wetness, as measured by months per year when the absolute value of SPI exceeds specified thresholds. Shown are results in locations projected to experience an increase (Top) or decrease (Bottom) in annual mean precipitation. (Left) Results for drought and (Right) results for periods of unusual wetness. Red curves show results for SPI < −1 (Left) or SPI > 1 (Right). Blue curves show results for SPI < −2 (Left) or SPI > 2 (Right).

