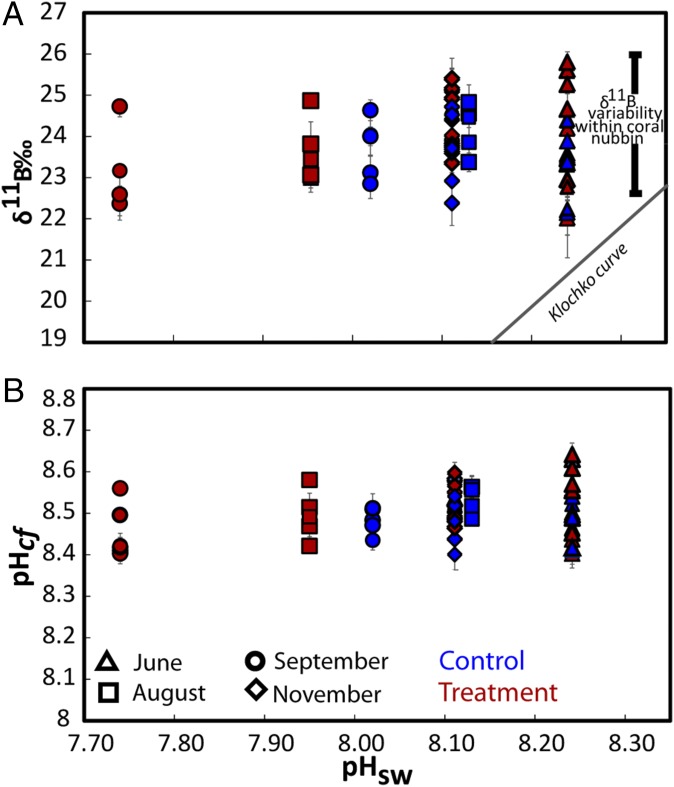
Fig. 2.
(A) Measured δ11B composition of all nubbin colonies from treatment (red symbols) and control (blue symbols) flumes vs. the average measured pH seawater conditions at June, August, September, and November 2010 within control and treatment flumes during the FOCE experiment. The boron isotope composition of all samples is elevated relative to the abiotic curve provided by Klochko et al. (50). (B) pH of the calcifying fluid (pHcf) derived from the δ11B shown in A using Eq. 2. A linear mixed effects model indicated only a modest dependency of pHcf on pHsw (= 0.067, P = 0.078, df = 36; Table S2 and Fig. 2B).

