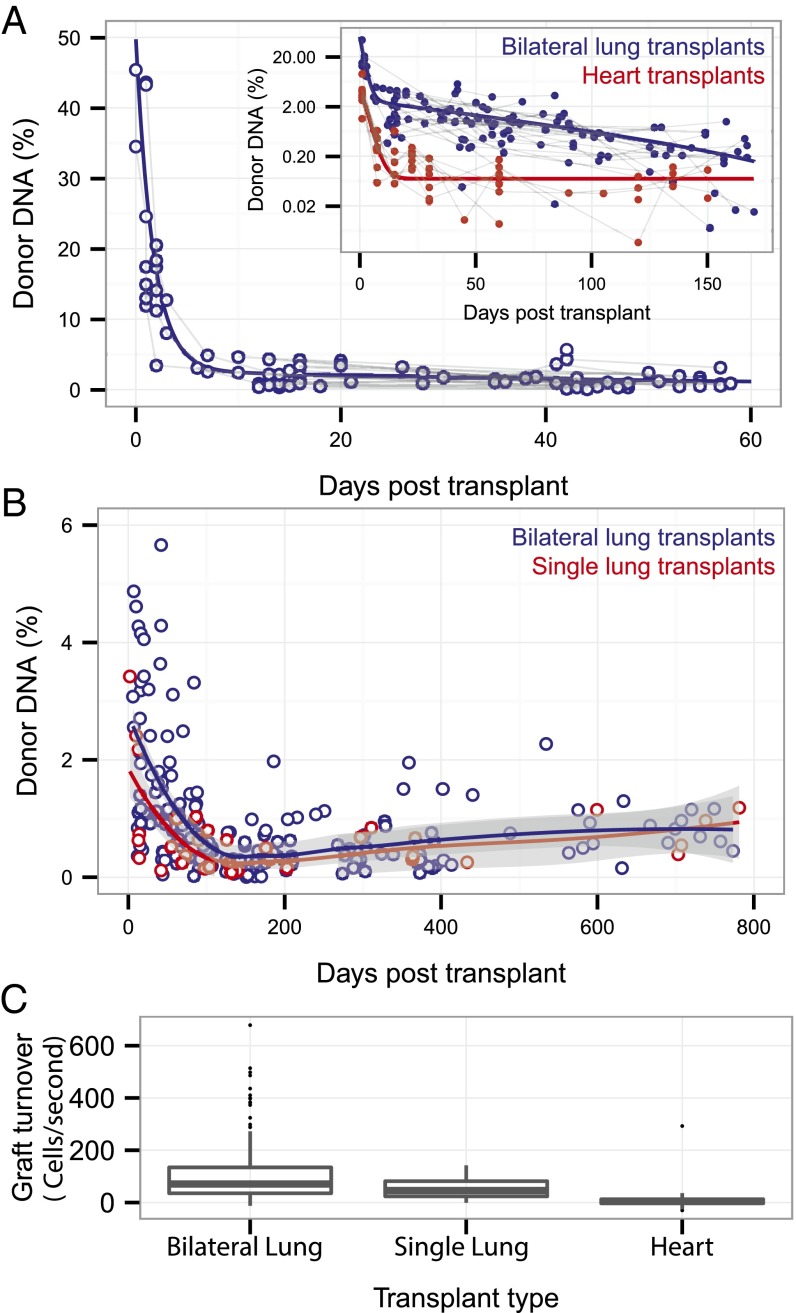
Fig. 2.
Early and late posttransplant cell-free DNA dynamics and organ-specific features. (A) Fraction of donor-derived cell-free DNA during the first 2 mo posttransplant for rejection-free lung transplant recipients. Donor cfDNA levels were higher for lung than for heart transplant recipients. (Inset) Data for heart transplants from ref. 11. (B) Donor cfDNA levels measured for single- and double-lung transplants throughout the posttransplant course in rejection-free patients. Solid lines are fits (local polynomial regression, smoothing parameter alpha 0.75; gray shading indicates 90% confidence interval). (C) Estimate of graft cell-decay rate from measurements of the fraction of donor cfDNA. Data are shown as boxplots. The bottom and top of the box indicate the upper and lower quartile, the band inside the box indicates the median.

