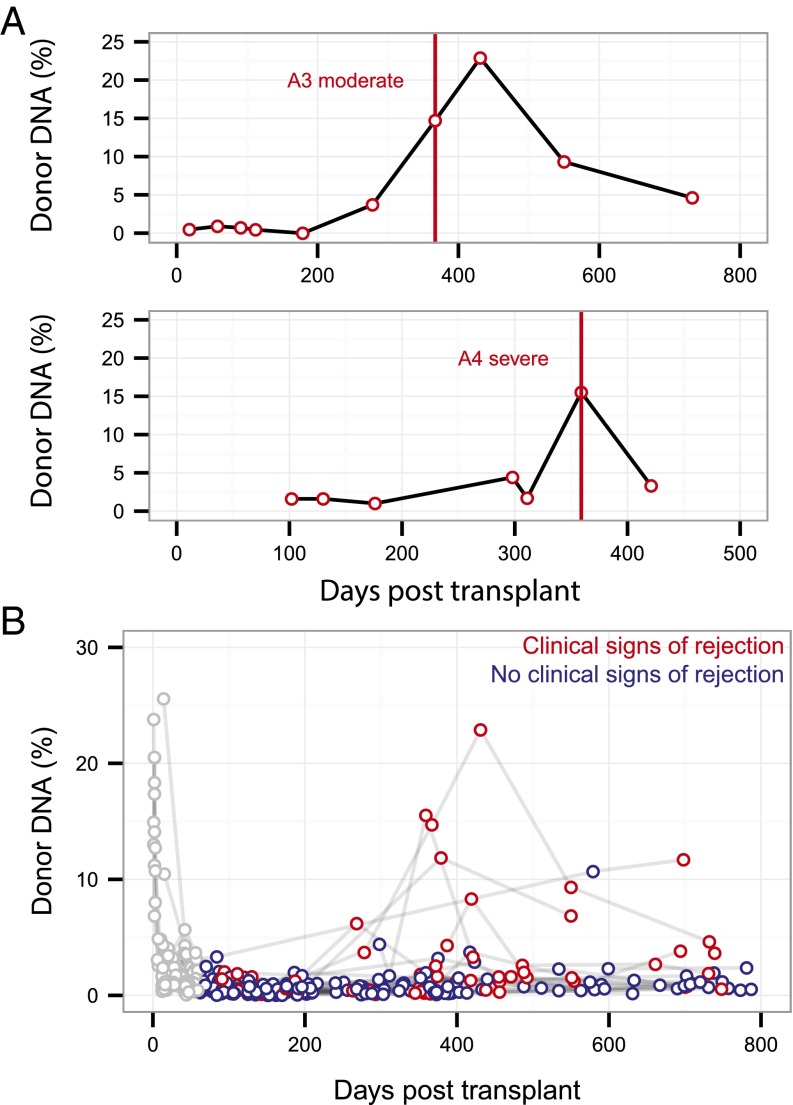
Fig. 3.
Cell-free donor DNA at rejection. (A) Donor cfDNA level measured for patients diagnosed with a moderate or severe acute rejection event, with vertical lines indicating rejection diagnosis via transbronchial biopsy. (B) Overview of all data collected for 51 lung transplant recipients (n = 398 samples) highlighting points measured in the absence (blue) and presence (red) of clinical signs of rejection. Data collected during the first 2 mo posttransplant are shown in gray, with early time dynamics excluded from signal analysis.

