Fig. 4.
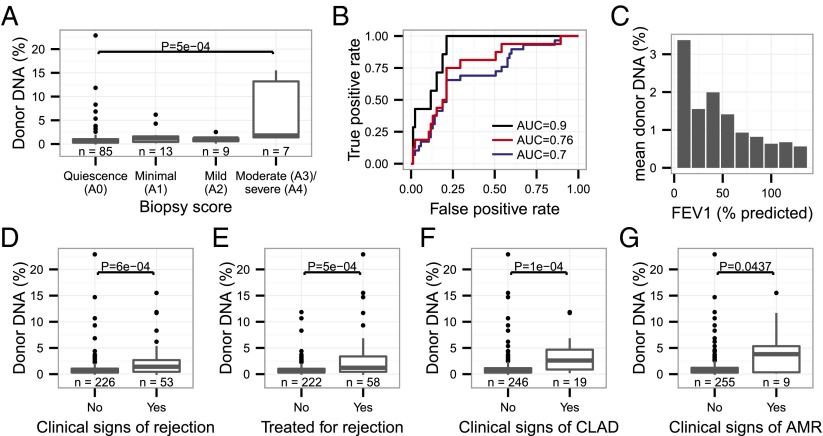
Analysis of the performance of cfdDNA as a marker for lung transplant rejection. (A) cfdDNA levels by transbronchial biopsy score. (B) ROC analysis of the performance of cfdDNA in classifying rejection-free versus rejecting patients (black line, A0 vs. A3–A4, moderate-to-severe rejection, AUC 0.9). Also shown are ROC analyses of the test performance in distinguishing rejection-free patients and patients with mild-to-severe rejection (red line, A0 vs. A2–A4, AUC 0.76) and the performance in distinguishing rejection-free and patients with minimal-to-severe rejection (blue line, A0 vs. A1–A4, AUC 0.7). (C) cfdDNA levels versus FEV1 level (% predicted given age, sex, and body composition). (D–G) cfdDNA levels by (D) the presence or absence of clinical signs of acute rejection, (E) decision to treat for acute rejection, (F) CLAD, and (G) clinical signs of AMR. Data are shown as boxplots in A, D–G. The bottom and top of the box indicate the upper and lower quartile, the band inside the box indicates the median.

