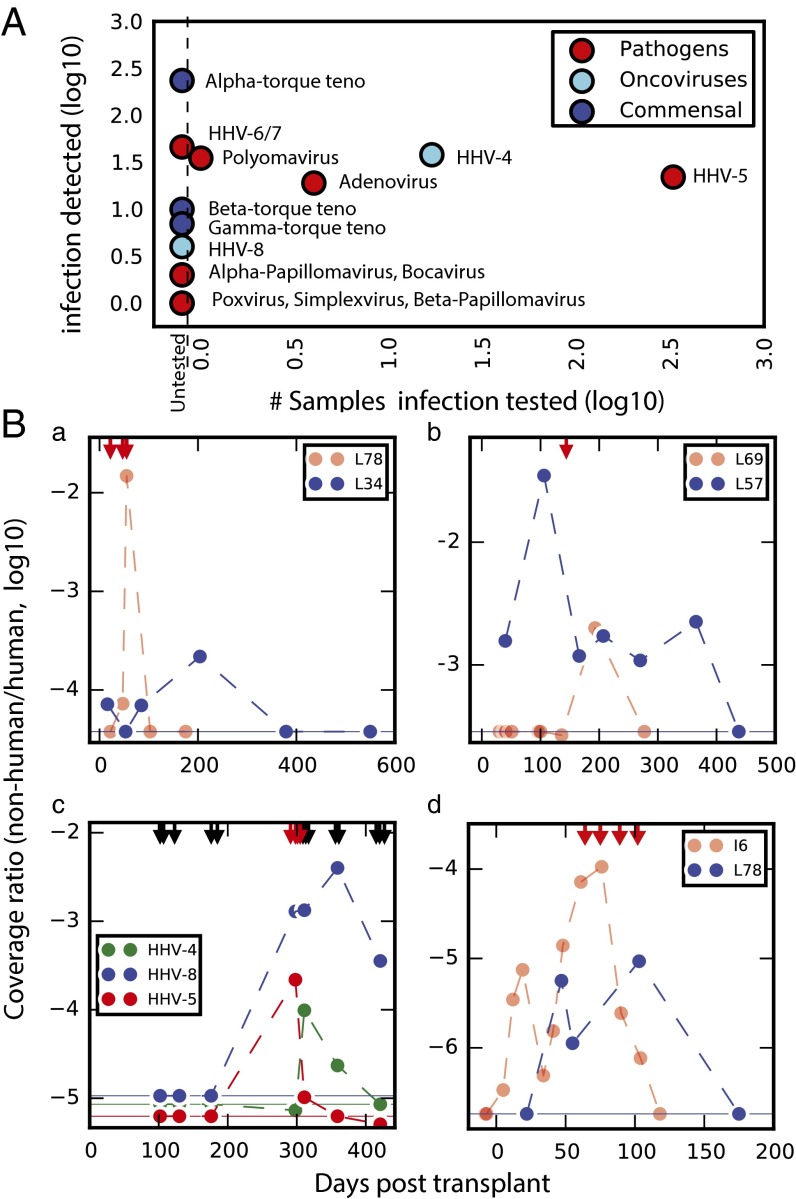
Fig. 6.
Monitoring the infectome. (A) Clinical testing frequency compared with the incidence of viral infections detected in sequencing. (B) Time-series data for patients who tested positive (red arrows) for specific infections relative to those who were not tested. (a) Coverage ratio for adenovirus in L78 with clinical positives highlighted relative to an untested patient (L34). (b) Coverage ratio for polyomavirus in L69 with one positive test relative to sustained signal in an untested patient (L57). (c) Three herpesvirus infections (HHV-4, -5, and -8) in L58 with both positive (red) and negative (black) tests for CMV (HHV-5) highlighted. (d) Coverage ratio for microsporidia in I6, with four positive tests shown, relative to the signal observed in patient L78, who had symptoms of microsporidiosis but was not tested. In all cases, the logged coverage ratio (organism coverage relative to human coverage for the sample) is reported. Because the data are logged, zero values were replaced with the detection limit of the assay (horizontal lines indicate the coverage ratio obtained for a single read assigned to the organism in the given sample).

