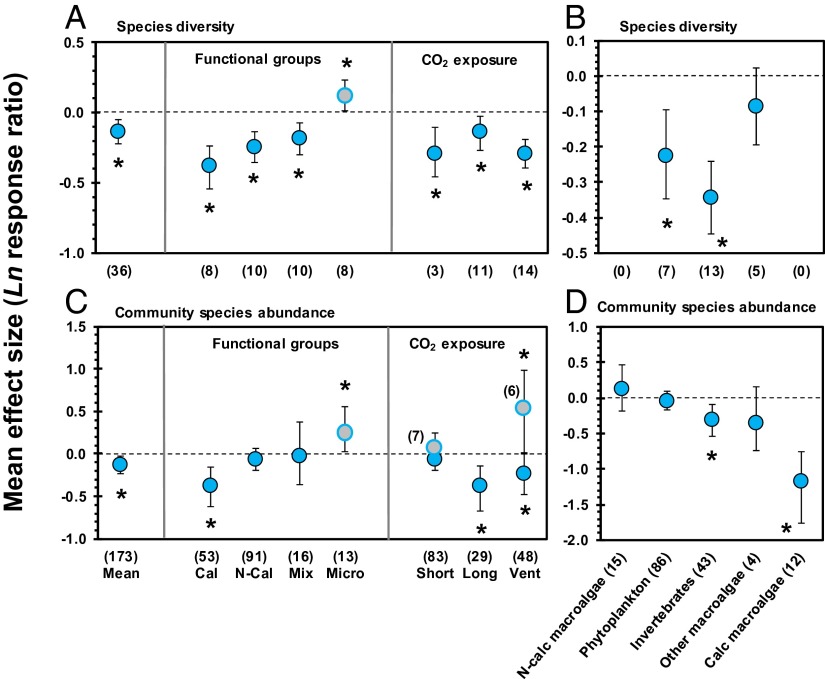
Fig. 2.
Effect of ocean acidification on species diversity and abundances based on multispecies experiments. Mean effect size and direction of impacts of ocean acidification on species diversity (A and B) and abundances of species within communities, for multispecies studies only (C and D). (A and C, Left) Overall mean effects. (A and C, Center) Categorical effects where data are split for various functional groups: calcifying species alone (Cal), noncalcifying species alone (eukaryotes) (N-Cal), mixed communities of calcifiers and noncalcifiers (Mix), and microorganisms (Micro) (blue circles with gray filling). (A and C, Right) Effect sizes for short-term (<1 mo.) vs. longer-term (1–13 mo.) vs. in situ studies on natural CO2 vents, separated for microbes and all other species. (B and D) Effect sizes for different species groups. Error bars represent 95% confidence intervals. Numbers between brackets indicate sample size. *P ≤ 0.05.

