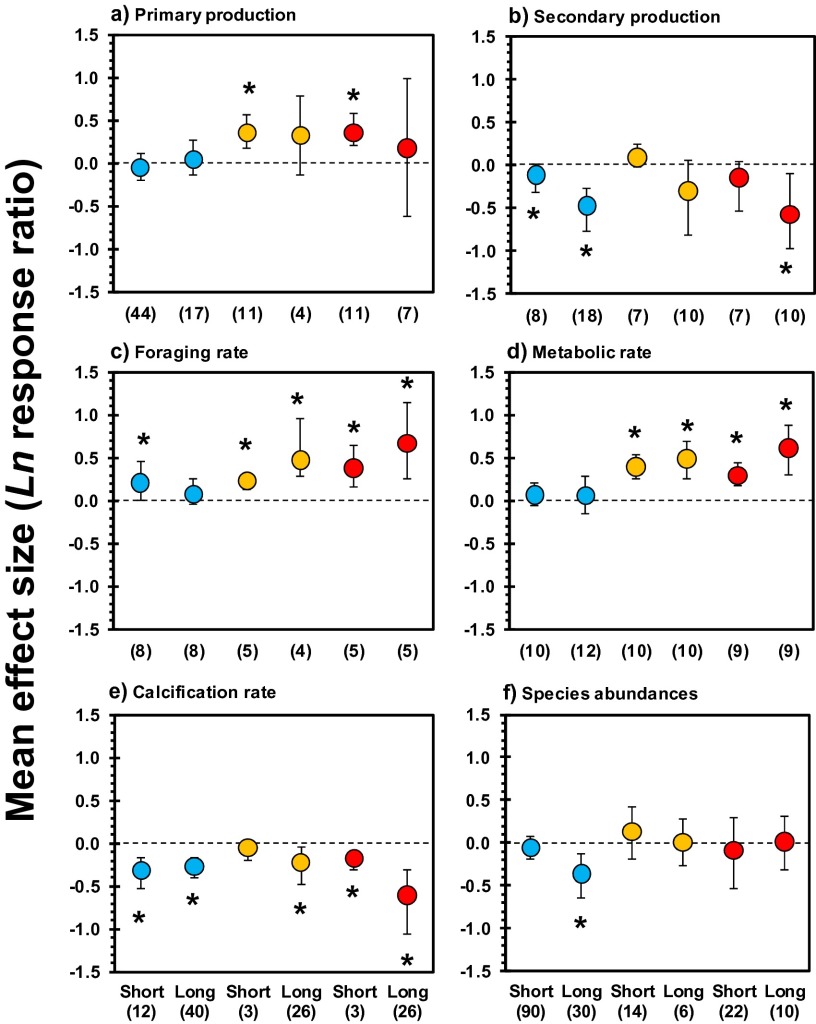
Fig. S1.
Mean effect sizes and direction of impacts of ocean acidification (OA) (blue) and ocean warming (T) (orange) and their combined effects (OA × T) (red) showing the effect of experimental exposure time for primary production (A), secondary production by invertebrates (B), foraging rate (C), metabolic rate (D), calcification rate (E), and species abundances (F). Short: duration of experiment <1 mo; Long: duration of experiment 1–13 mo. Error bars represent 95% confidence intervals. Numbers between brackets indicate sample size (number of experiments). *P ≤ 0.05. For main effects, see Figs. 1 and 2.

