
Fig. 3.
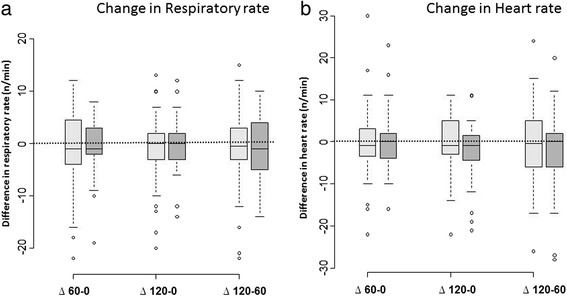
Respiratory rate (panel a) and heart rate (panel b) changes during the 2-h study period. The open bars represent the high-flow nasal oxygen group and the gray bars the Venturi mask group. ∆60-0 indicates the difference between randomization and the 1-h time point. ∆120-60 indicates the difference between the 1-h and 2-h time points. ∆120-0 indicates the difference between randomization and the 2-h time point