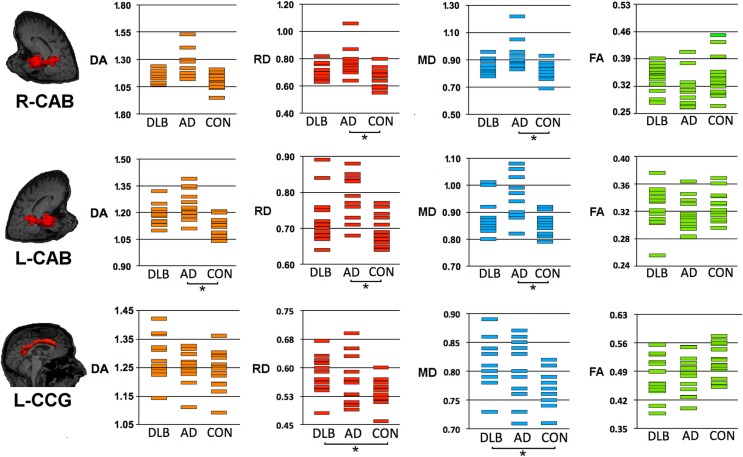
Figure 2.
Structural connectivity showing DTI-metrics values for left cingulum-angular (infracallosal) cingulum-angular bundle (CAB) and bilateral cingulum-cingulate gyrus (supracallosal) bundle (CCG). Representative images showing TRACULA output: the tract of interest is colored in red and overlaid on individual’s structural image. The distribution of DTI-metrics values within each tract of interest and within group is reported in the scatter-plots: orange, red, blue, and green rectangles represent axial diffusivity (DA), radial diffusivity (RD), and mean diffusivity (MD), respectively. Significant differences between groups are marked with dark lines and asterisks. The values of DA, RD, and MD are reported as values ×10−3mm2/s. AD, Alzheimer’s disease; DLB, dementia with Lewy bodies; R, right; L, left.

