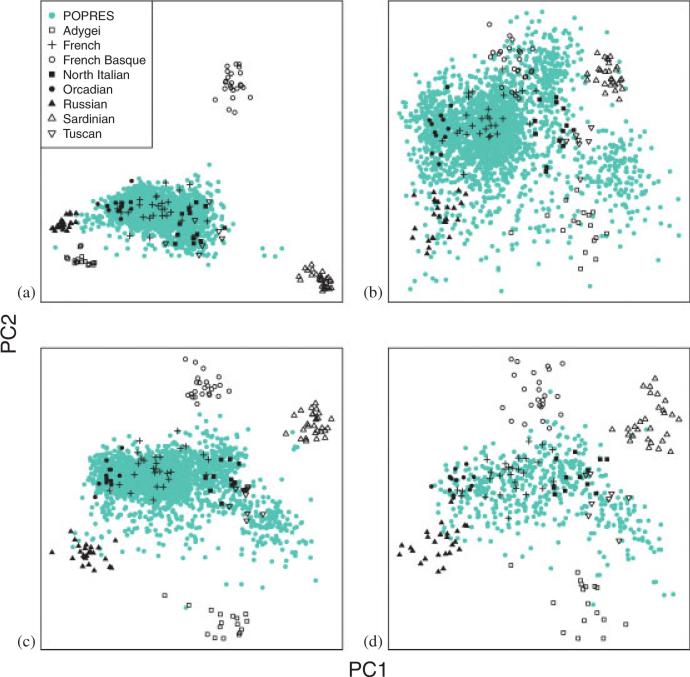
Figure 3.
HGDP and POPRES eigenmap representations plotted for various ancestry bases. In each panel, the eigenvectors (labeled PC) are calculated using a portion of the data, called the base. The remaining samples are projected using the Nystrom approximation. For each eigenmap we show only the top two principal components, POPRES (turquoise) and HGDP (black). (a) Base = HGDP, projected = POPRES; (b) Base = POPRES, projected = HGDP; (c) Base = HGDP + half of POPRES, projected = half of POPRES; and (d) Base = half of the balanced subset of countries including HGDP, projected = remaining half of the balanced subset.

