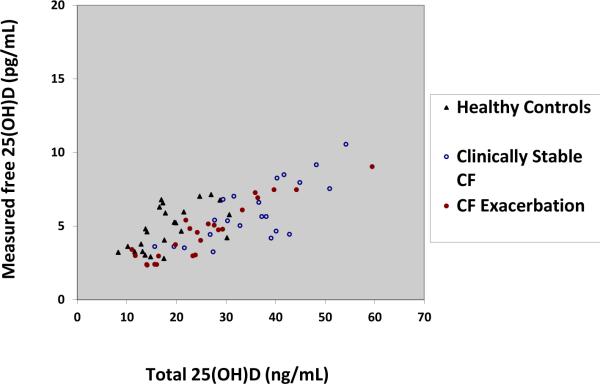
Figure 1. Total 25(OH)D vs. Measured free 25(OH)D in non African Americans with and without cystic fibrosis.
Total 25(OH)D concentrations are plotted on the x-axis and directly measured free 25(OH)D concentrations are plotted on the y-axis. Both variables were normally distributed. The closed triangles represent non-African healthy control subjects, the open circles represent non-African clinically stable CF subjects and the closed circles represent non-African CF exacerbation subjects. Total 25(OH)D concentrations were significantly associated with direct measures of free 25(OH)D with an adjusted β-coefficient of 0.14 (p<0.001).

