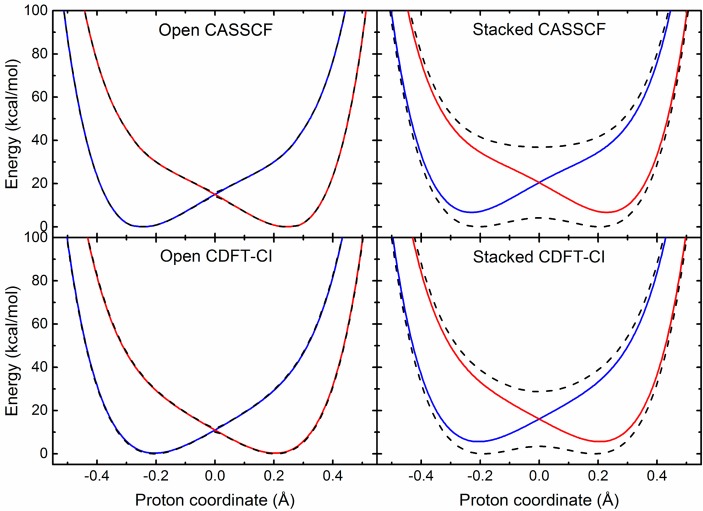
Figure 4.
Adiabatic (black dashed lines) and diabatic (blue and red solid lines) proton potential energy curves for the open (left panels) and stacked (right panels) geometries of the phenoxyl-phenol system obtained using the CASSCF/6-31G** (upper panels) and CDFT-CI/ωB97X/6-31G** (lower panels) methods.

