
Figure 6.
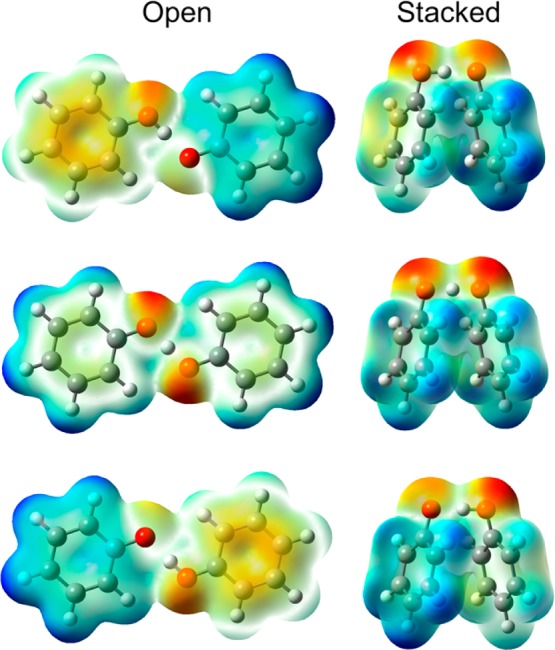
Electrostatic potential maps for the ground adiabatic electronic states generated with DFT/ωB97X/6-31G** for the reactant (top), transition state (middle), and product (bottom) positions of the transferring hydrogen for the open (left) and stacked (right) geometries of the phenoxyl-phenol system. The density isosurface value is 0.005, and negatively and positively charged regions are indicated by red and blue coloring, respectively.