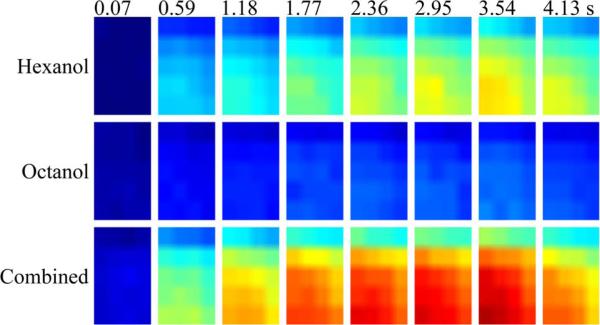
Fig. 18.
Spatial activation of neural activity across the locust's antennal lobe. Each 2-D map is a dorsal view, with the left as lateral, right as medial, top as caudal, and bottom as rostral. The eight images per row represent neural activity at particular time intervals indicated at top of each column. Refer to Video 3 in the supplementary material.

