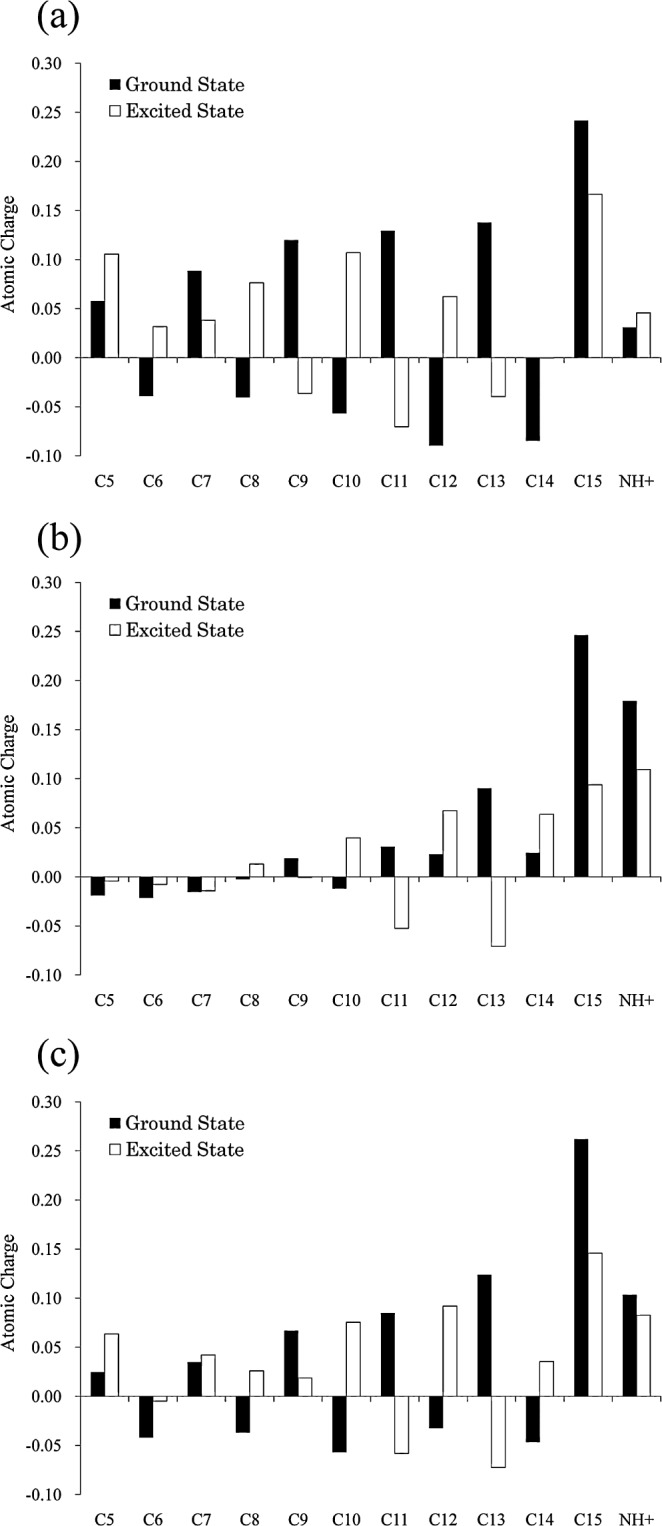
Figure 4.

The charge distribution along the retinal polyene chain. Each value of charge corresponds to the sum of the charge on the carbon atom of interest and those on the attached H atoms. (a) The data for the gas-phase PRSB, whose geometry was optimized at the B3LYP/6-31G(d,p) level. (b) The data for the supermolecular complex composed of PRSB and the counterion residues (Asp85, Asp212 and W402). Its geometry was taken from the optimized bR (model 3). (c) The data for PRSB in bR (model 3).
