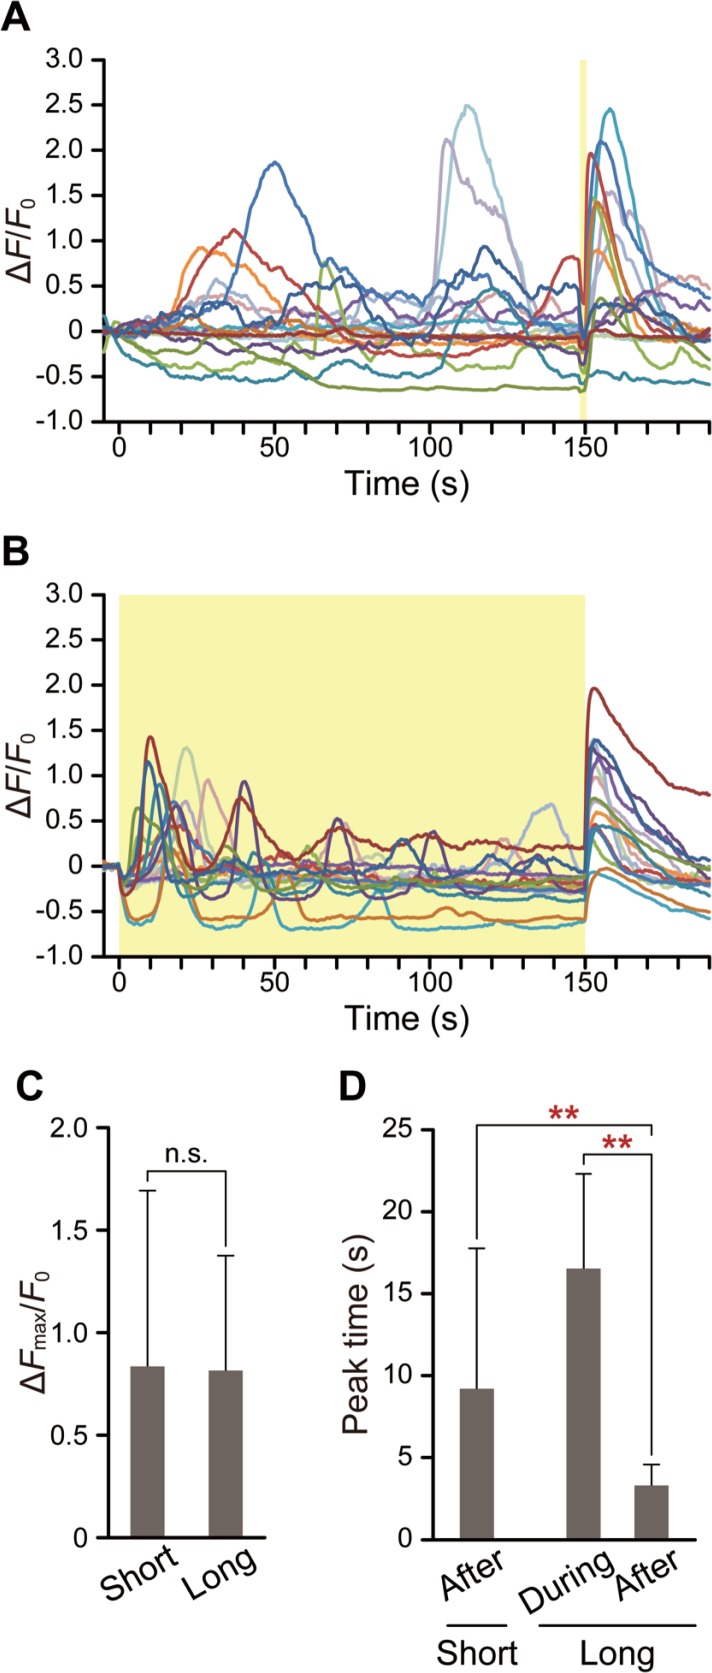
Figure 4.
Effect of heating duration on peak time. (A and B) Time course of ΔF/F0 following short, 2-s (A, n=17 cells) or long, 150-s (B, n=16 cells) heat pulses. The laser power as displayed on the controller was 1.58 W. Yellow areas represent the duration of IR laser irradiation. (C) Effect of heating duration on the peak value of the Ca2+ burst that occurred after re-cooling. Mean±standard deviation was calculated from the data shown in (A) and (B) (p=0.82). (D) Comparisons of the time required to reach the peak value of the first Ca2+ burst during heating and after re-cooling. Mean±standard deviation was calculated from the data shown in (A) and (B). Two data points that did not have peaks are excluded. p=1.7×10⁻³ (after the short heat pulse) and p=3.9×10⁻⁶ (during the long heat pulse) were determined with respect to the peak time after the long heat pulse. All measurements were performed at 26.5°C. Significant differences are indicated by double asterisks (p<0.01). Data at each time point were normalized by the average value from −5 s to 0 s (F0).

