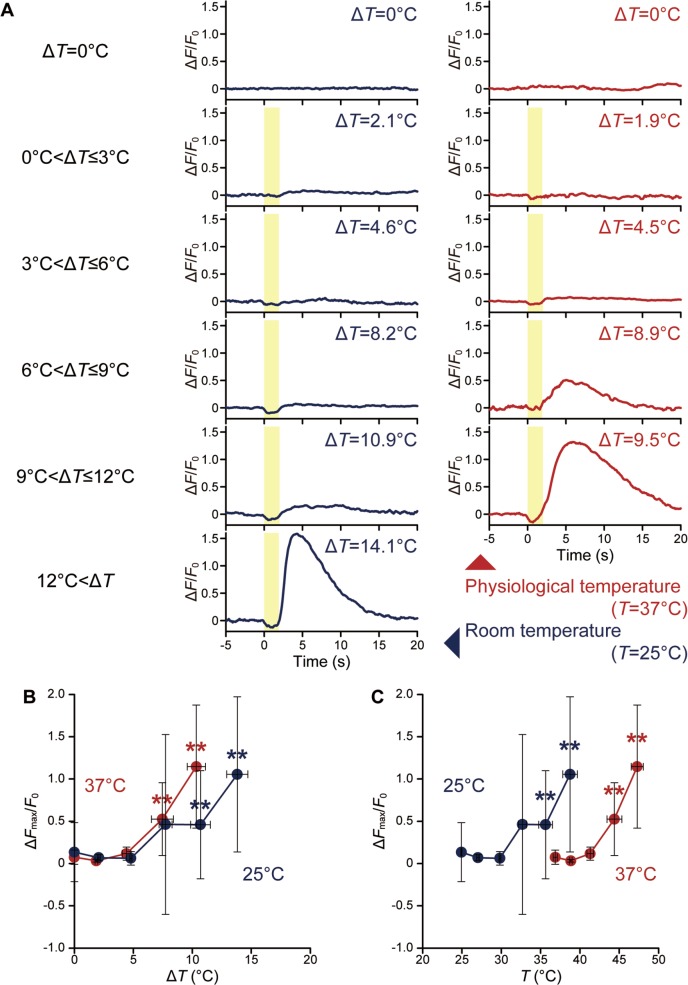
Figure 5.
Effect of ambient temperature on thermosensitivity for a short (2 s) heat pulse. (A) Time course of ΔF/F0 in a cell exposed to various ΔT at room and physiological temperatures (25°C and 37°C, respectively). The duration of irradiation is indicated by the yellow area. (B) Relationship between ΔT and ΔFmax/F0. Plots display mean ΔFmax/F0 for ΔT=0°C, 0°C<ΔT≤3°C, 3°C<ΔT≤6°C, 6°C<ΔT≤9°C, 9°C<ΔT≤12°C, and 12°C<ΔT. (C) Relationship between T (=ambient temperature+ΔT) and ΔFmax/F0. Plots and curves at 25°C (n=58 cells) and 37°C (n=57 cells) are shown in blue and red, respectively. Error bars represent the standard deviation of the ΔFmax/F0 and ΔT (B) or T (C). Significant differences against ΔT=0°C are indicated by double asterisks (p<0.01). Individual plots are shown in Supplementary Figure S3. Data at each time point were normalized by the average value for 5 s before heating (F0).

