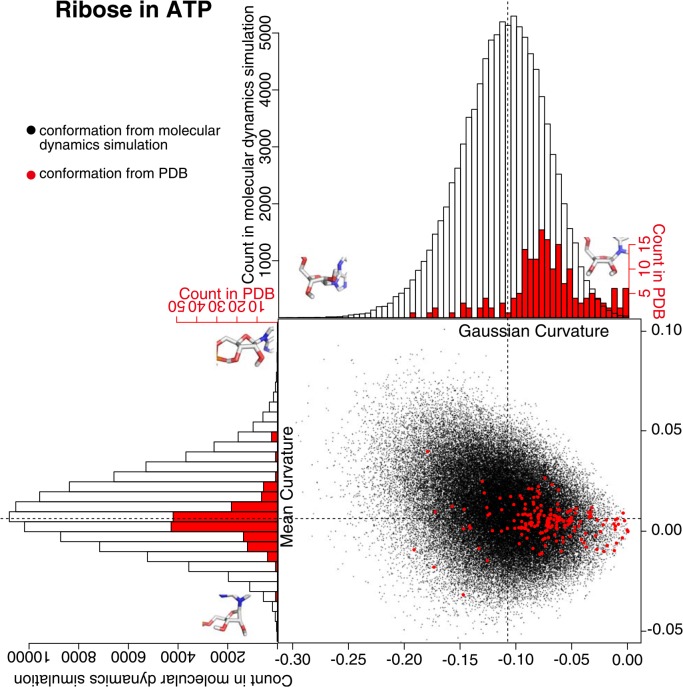
Figure 4.
Ribose curvature in the conformations from molecular dynamics simulation and from PDB. A black dot is obtained from the snap shot conformation form the molecular dynamics simulation, and a red dot is from PDB. The histogram in black clarifies the distribution of black dots, and the one in red clarifies the distribution of red dots. The ribose with minimum/maximum curvature values in the snap shot conformations from the molecular dynamics simulation were drawn on the histograms.

