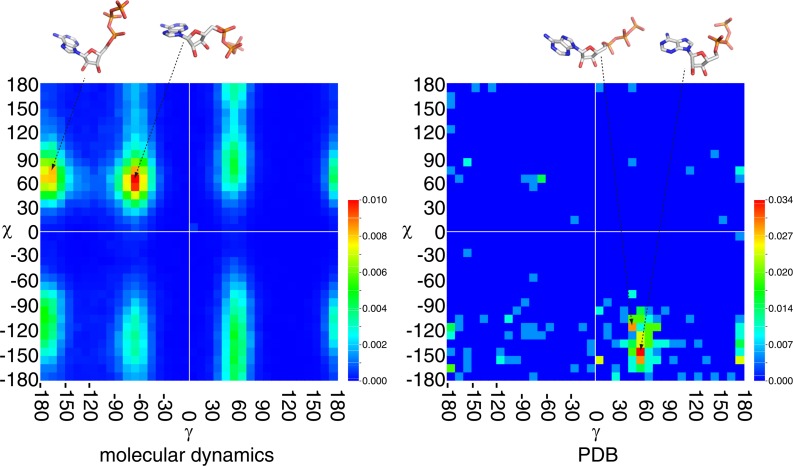
Figure 9.
Probability density function map of the torsion angles &gamma and χ. The left map is derived from the snap shot conformations of the molecular dynamics simulation, and the right map is from the conformations in PDB. The probability is depicted in rainbow colour scheme from blue to red in ascending order as shown in the colour bars. Note that the dynamic range of the two maps is different. One of the structures in highly populated torsion angles is shown on the top.

