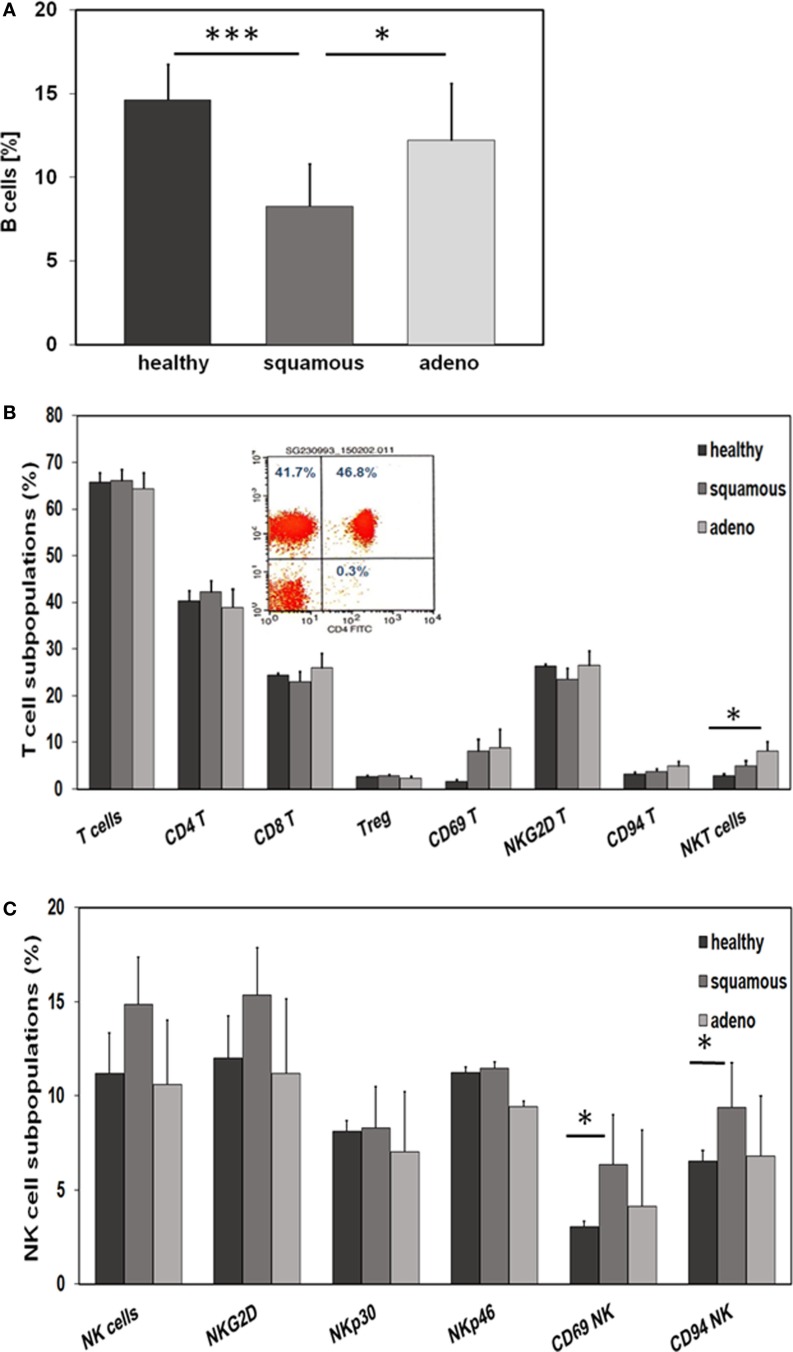
Figure 4.
Comparison of the immune phenotype of squamous cell and adeno NSCLC patients with healthy donors. (A) Relative amount of B cells in the blood of healthy donors (n = 10), squamous cell (n = 25) and adeno (n = 18) NSCLC patients, as determined by FACS analysis (patient collective #1); *p < 0.05, ***p = 0.001 (Mann–Whitney U-test). (B) Percentage of T cell subpopulations in the blood of healthy donors (n = 10), squamous cell (n = 25) and adeno (n = 18) NSCLC patients (patient collective #1); *p < 0.05 (Mann–Whitney U-test). A representative example of the analysis of CD3+/CD4+ helper T cells by FACS analysis is shown in the inset (percentages of positively stained cells are shown in each quadrant of the dot blot). (C) Percentage of NK cell subpopulations in the blood of healthy donors (n = 10), squamous cell (n = 25) and adeno (n = 18) NSCLC patients (patient collective #1); *p < 0.05 (Mann–Whitney U-test).

