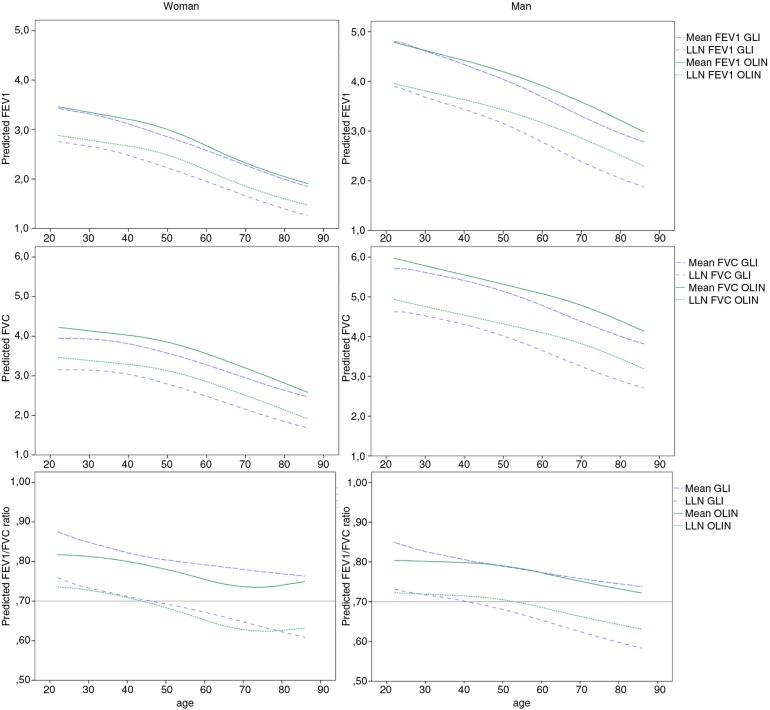
Fig. 2.
(a–f) Sex- and age-dependent decline in the OLIN reference values (mean and LLN) in comparison with GLI. The predicted mean and LLN for the OLIN and the GLI reference values are plotted against age, for FEV1, FVC and the FEV1/FVC ratio, respectively. Figures (a), (b) and (c) display predicted values for a 165 cm tall woman, while (d), (e) and (f) display predicted values for a 180 cm tall man.

