
Figure 3.
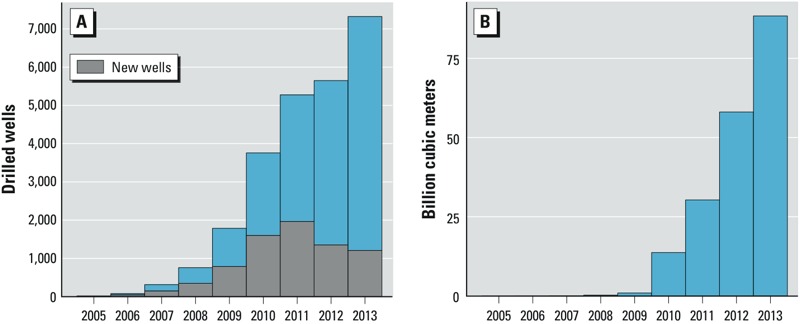
(A) Number of new unconventional wells drilled annually during 2005–2013 (gray) and cumulative number of wells. (B) Unconventional natural gas produced (billions of cubic meters) during 2005–2013.
Official websites use .gov
A
.gov website belongs to an official
government organization in the United States.
Secure .gov websites use HTTPS
A lock (
) or https:// means you've safely
connected to the .gov website. Share sensitive
information only on official, secure websites.
(A) Number of new unconventional wells drilled annually during 2005–2013 (gray) and cumulative number of wells. (B) Unconventional natural gas produced (billions of cubic meters) during 2005–2013.