
Figure 4.
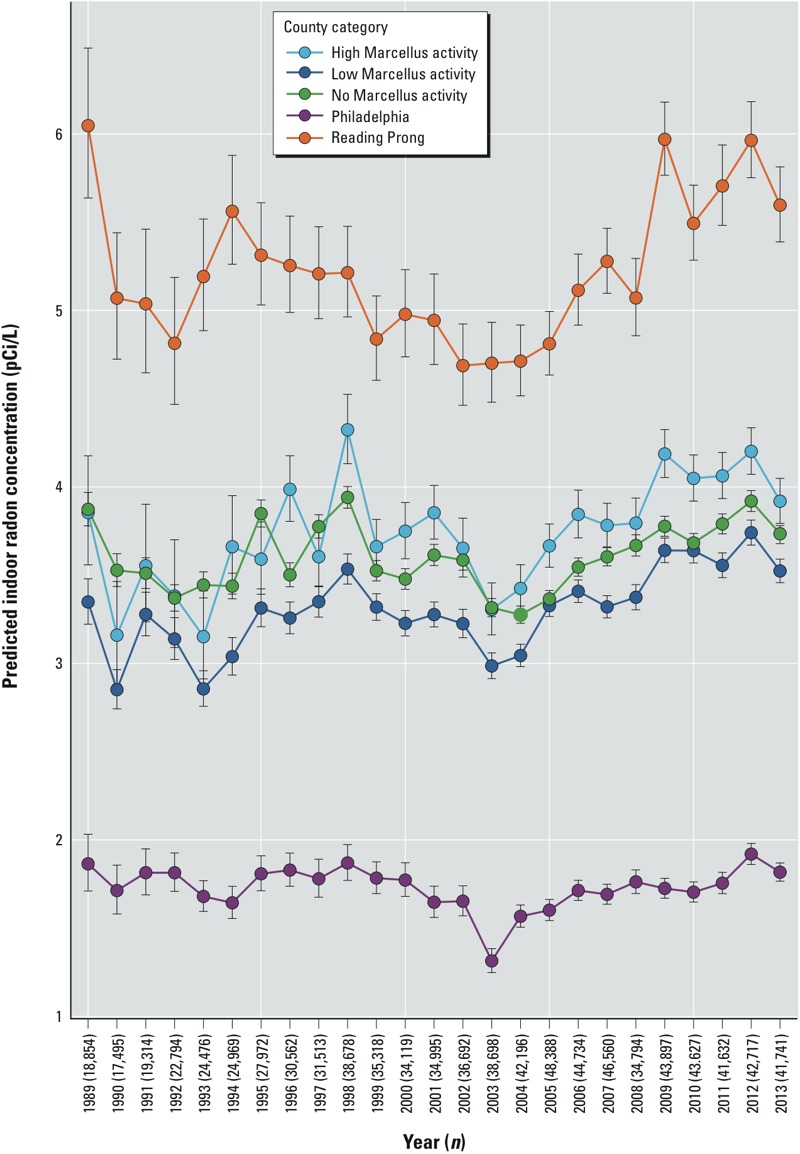
Geometric mean and 95% confidence intervals for indoor basement radon concentrations in five county categories, 1989–2013. High Marcellus shale counties had at least 100 unconventional wells drilled by 2013, and low Marcellus shale counties had 1–100. Predicted values were generated from five separate linear regression models (one for each county category) including only measurements taken on the first test date at each building (n = 705,798 values), adjusted for test year (1989–2013), well water use, 13 building types, five test types, test duration, season, weather (average temperature and rainfall with linear, quadratic, and cubic terms), minor civil division, and 179 mutually exclusive geologic units (model 2).