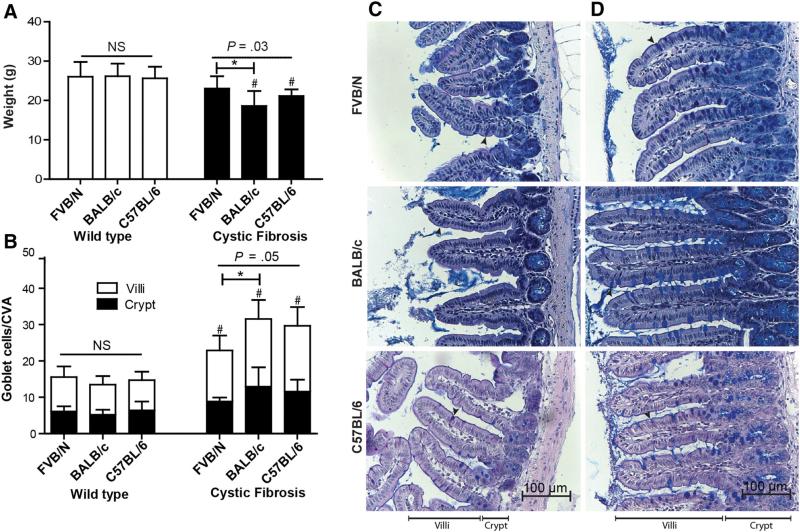
Fig. 1.
Body weight and ileal goblet cell counts of FVB/N Cftrtm1Eur, BALB/c Cftrtm1UNC, C57BL/6 Cftrtm1UNC, and WT control mice at 12 weeks of age. a Weights of mice at sacrifice. b Number of goblet cells per crypt to villus axis (CVA), (villus open square; crypt filled square). Data are presented as the mean ± SD (n = 5–13 mice/group). Horizontal bars indicate groups compared by ANOVA (NS not significant). *Indicates a significant difference, P < 0.05, by Tukey's post hoc test. # Indicates a significant difference, P < 0.05, between CF and WT mice within each strain by Student's t test. Representative ileal sections of c a wild-type control mouse from each strain, and d FVB/N Cftrtm1Eur, BALB/c Cftrtm1UNC and C57BL/6 Cftrtm1UNC mice featuring hyperplasia of goblet cells (arrows). Periodic acid-Schiff//Alcian Blue stain, magnification ×400

