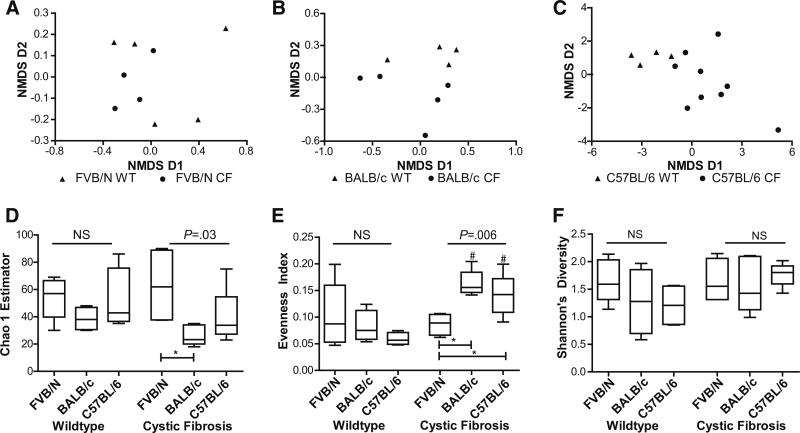
Fig. 4.
Small intestinal microbiome community metrics for FVB/N Cftrtm1Eur, BALB/c Cftrtm1UNC, C57BL/6 Cftrtm1UNC, and WT control mice. Two dimensional non-metric multidimensional scaling (NMDS) of the Bray-Curtis dissimilarity between samples for a FVB/N Cftrtm1Eur mice, b BALB/c Cftrtm1UNC mice, c C57BL/6 Cftrtm1UNC mice, and respective wild-type mice. d Richness was measured using the Chao 1 estimator. e Evenness defined by Simpson's Evenness. f Diversity, measured with Shannon's Diversity Index. Data are presented as mean ± SD (n = 4–9 per group). Horizontal bars indicate groups compared by ANOVA (NS not significant). *Indicates a significant difference, P < 0.05, by Tukey's post hoc test. # Indicates a significant difference, P < 0.05, between CF and WT mice within each strain by Student's t test

