Figure 2.


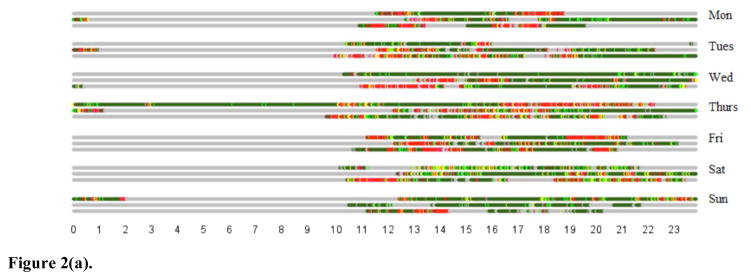
Figure 2(a). Temporal stress profile of participant P4. Each bar represents stress for a day. X-axis and Y-axis represent time-of-day and days-of-the-week respectively. Colors represent stress intensity (red = high stress, green = low stress, yellow = moderate stress, grey = unknown)
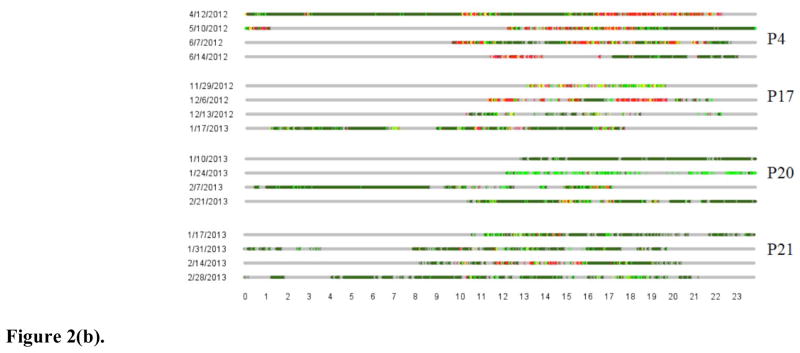
Figure 2(b). Temporal stress profiles of four participants. Colors represent stress intensity (red = high stress, green = low stress, yellow = moderate stress, grey = unknown). Each bar represents a day’s stress data, which are grouped by participants.
