Figure 3.

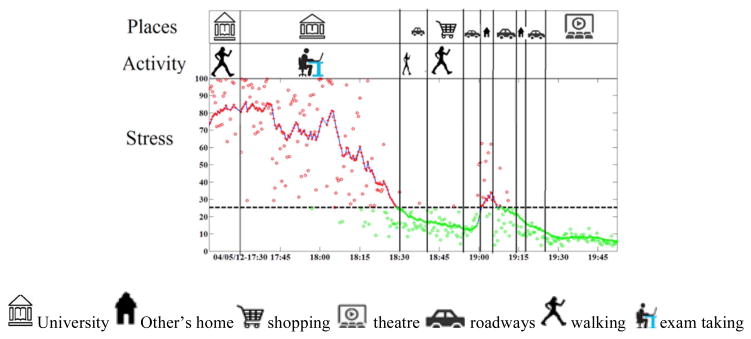
Contextual stress profile of a participant. X-axis shows time, Y-axis shows stress level and context (activity and location). Black dashed line represents baseline stress.

Contextual stress profile of a participant. X-axis shows time, Y-axis shows stress level and context (activity and location). Black dashed line represents baseline stress.