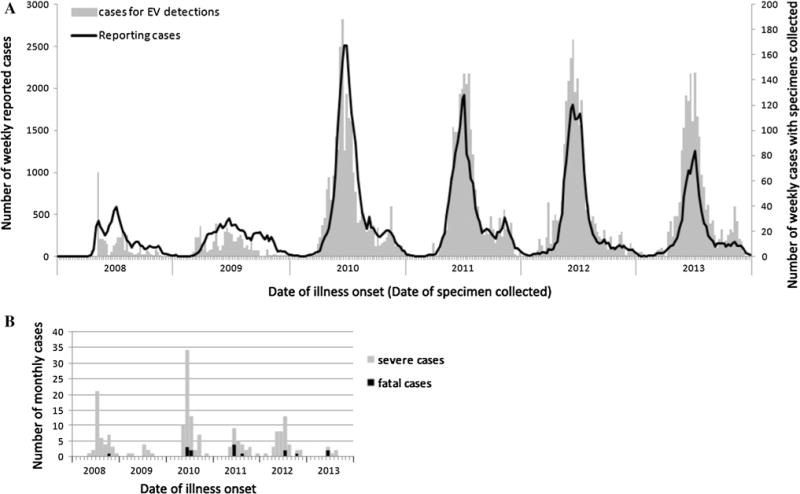
Fig. 1.

Temporal distribution of reported cases of HFMD and cases of EV detected in Tianjin, 2008–2013. (A) Weekly distribution of reported cases and cases with specimens collected for EV detection, indicated on the left and right axis, respectively. (B) Monthly distribution of severe and fatal cases
