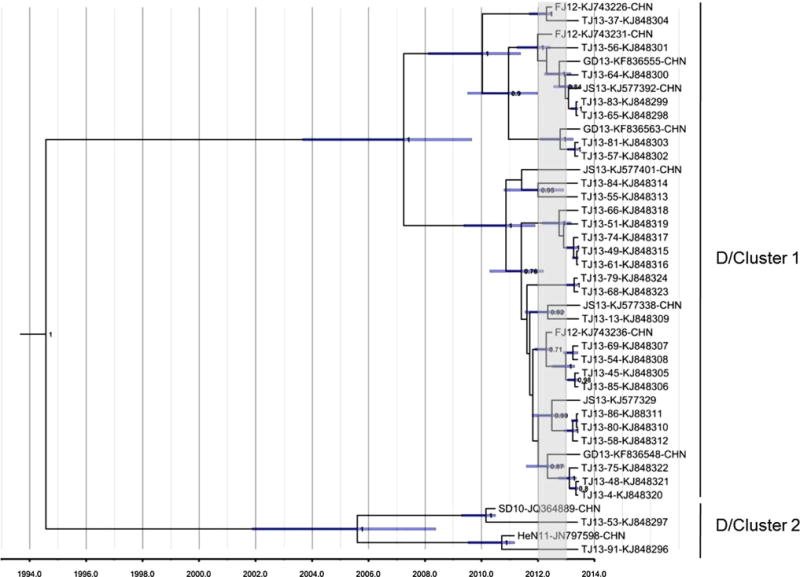
Fig. 4.

MCC tree of complete VP1 nucleotide sequences (915 nucleotides) of CV-A6 strains representing D1 and D2 clusters. The scale is in units of evolutionary time in years, using the relaxed clock model [5], with an estimated mean rate of 4.49 × 10⁻³ substitutions/site/year. The time period from year 2012 to 2013 is indicated by a gray rectangle
