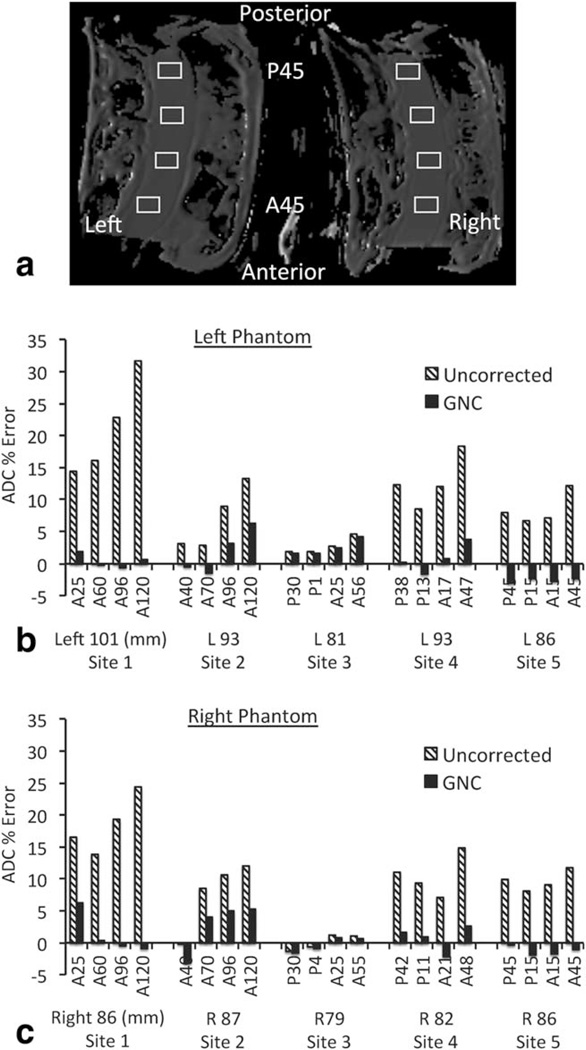
FIGURE 3.
ROI analysis of original and GNC phantom ADC maps from five imaging sites: (a) typical ROI placement (Site 5 image shown); (b,c) mean ROI ADC error (percent difference from the known value of 1.1 10−3 mm2/s) for left and right phantoms, respectively. Hatched bars show the original data ADC, solid bars show the GNC data ADC. Labels for each pair of data points give the anterior/posterior position of the ROI in mm, while the subtext gives the mean right/left offset of the four ROIs. AP positions illustrate the more vertically centered position for the coil used at Sites 3–5, while the generally smaller RL offsets in the right phantom may be due to image distortions. Site 1 results shown are for gradient system A.

