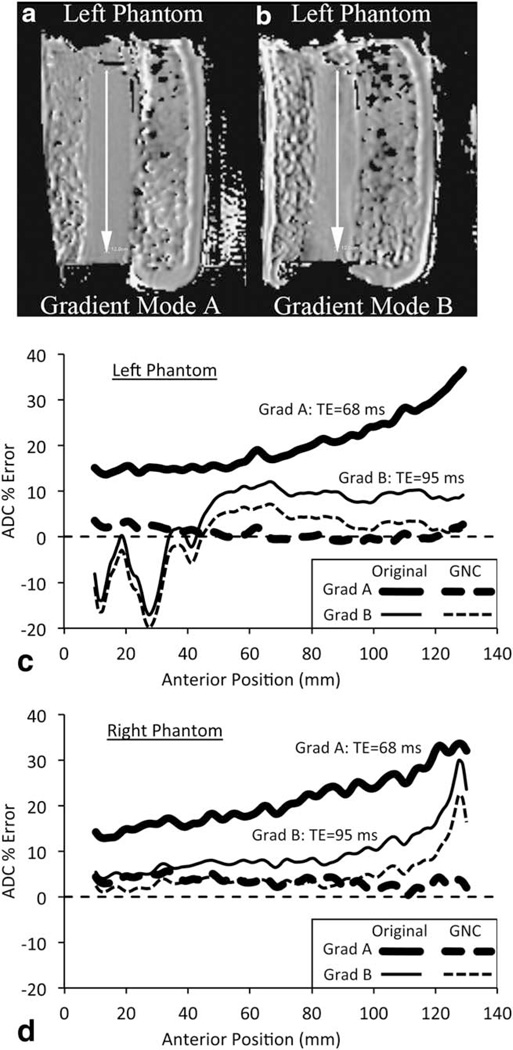
FIGURE 4.
Comparison of gradient modes A and B on the Site 1 scanner. (a,b) Left phantom GNC ADC maps for the two gradient modes. Increase in distortion and artifacts are visible in the slower speed gradient B image. (c,d) ADC error profiles along posterior-to-anterior lines as indicated by the arrows in (a,b) for left (c) and right (d) phantoms. Uncorrected (solid lines) and GNC (dashed lines) are shown for gradient system A (thick lines) and B (thin lines).

