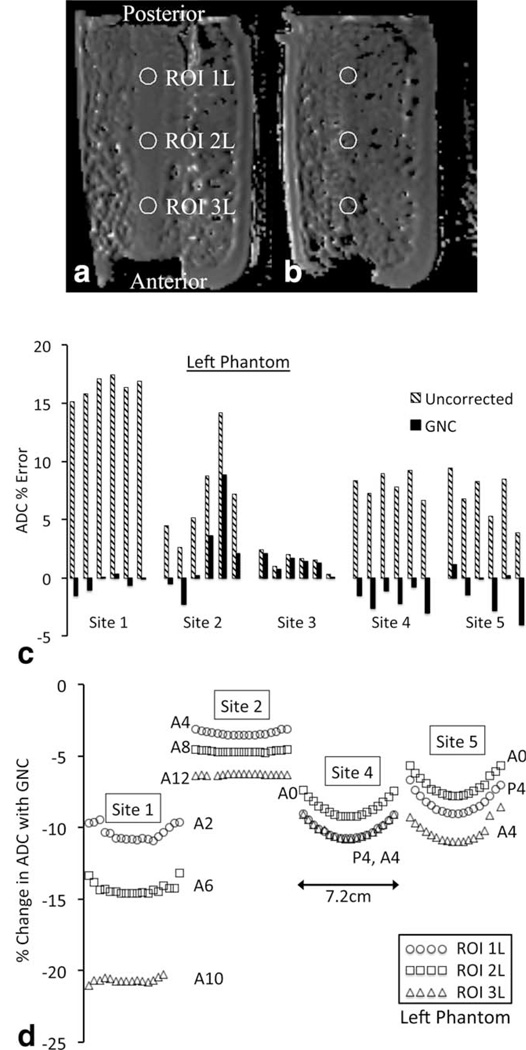
FIGURE 5.
Superior-inferior variations in GNC in the ice water phantom. Axial slice images of the left phantom showing circular ROIs (a) 1.2 cm superior offset at edge of the center tube and (b) 3.2 cm superior offset in the mixed ice-water region. (c) Percent error in ADC for the middle ROI, left phantom, for six slices (2.4 cm) within the central tube for each site. Uncor-rected data are shown in cross-hatched bars, GNC data in solid bars. (d) Variation in percent change in ADC with GNC across 18 slices (7.2 cm) for each ROI in the left phantom for Sites 1, 2, 4, and 5. Site 3 used larger blocks of ice, resulting in large signal voids preventing z-axis correction measurements outside of the central tube. Labels give AP position of the ROI. Circles, squares, and triangles represent ROIs 1L, 2L, and 3L, respectively.

