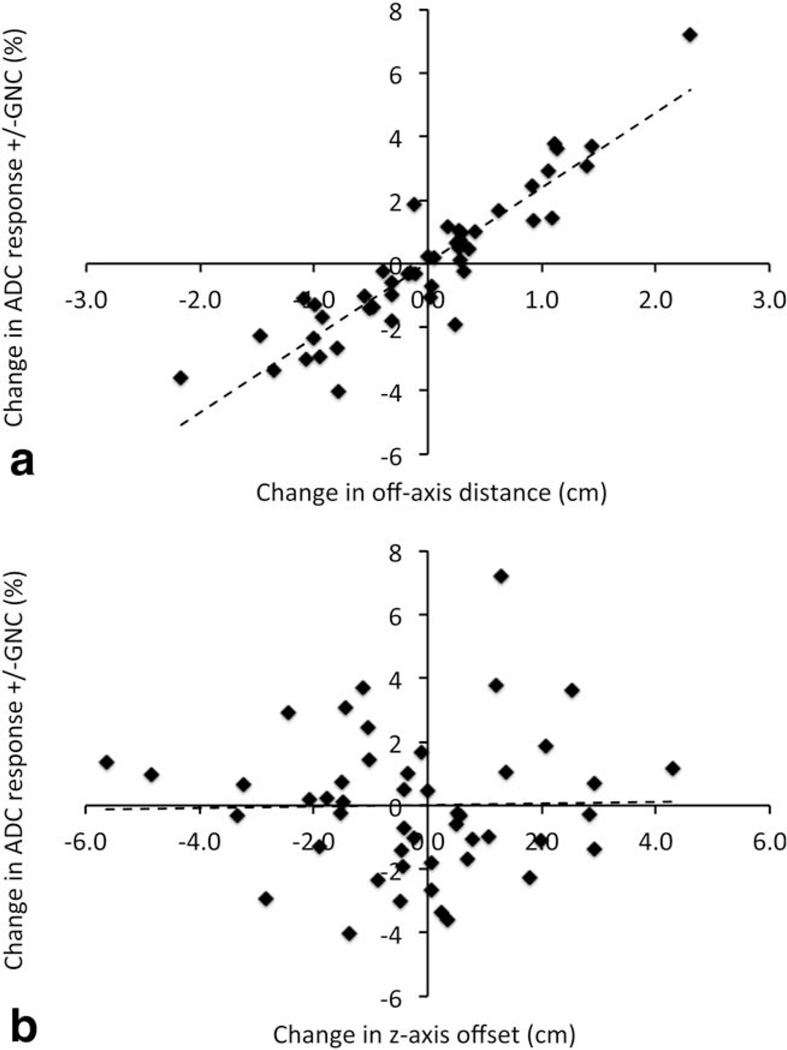
FIGURE 7.
Absolute change in measured ADC response (ΔADCet = percent change of the mean tumor ADC between MR1 and MR2) with application of GNC plotted versus difference in (a) the off-axis (combined AP and RL) distance and (b) the z-axis (SI) distance from magnet isocenter of the respective MR1 and MR2 ROIs. On average, each +1 cm change in off-axis position of the tumor ROI is seen to result in an apparent increase in the measured ADC response of 2.36% (CI 2.05, 2.67). No significant changes were observed due to changes in z-axis position.

