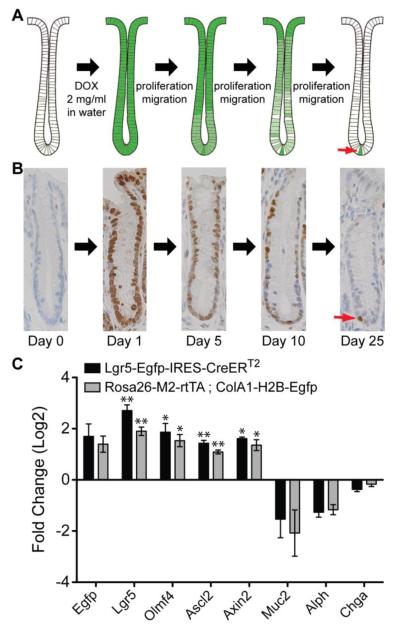
Figure 1.
H2B-Egfp label retention in the intestinal epithelium. (A) Schematic representation of the label retention time course. Rosa26-M2-rtTA; ColA1-H2B-Egfp transgenic mice have been described previously [10]. In this system, the M2 reverse tetracycline transactivator (M2-rtTA) is knocked into the Rosa26 locus, which is expressed in all cells in the adult mouse. Expression of the H2B-Egfp chimeric protein from the collagen 1a1 locus is regulated by a doxycycline response element. In the absence of DOX, H2B-Egfp is not expressed. When animals are administered DOX in the drinking water, M2-rtTA binds to the response element and induces expression of H2B-Egfp. (B) Immunohistochemistry for Egfp over the time course of the labeling experiment. Over time, only a single Egfp-positive cell remains at the bottom of the crypt, which is the slowly cycling stem cell (red arrow). Egfp immunohistochemistry is shown for crypts in the distal colon. (C) qRT-PCR data comparing expression patterns of stem cell markers in putative Egfp+ stem cells. In Egfp+ colonic epithelial cells from both Rosa26-M2-rtTA-ColA1-H2B-Egfp and Lgr5-Egfp-IRES-CreERT2 mice, there is a 3-4 fold enrichment of stem cell markers and a negative enrichment of differentiation markers. The qRT-PCR ratio values were computed as the normalized qRT-PCR signal from Egfp+ cells divided by the normalized qRT-PCR signal Egfp- cells from the same animal. Ratios were averaged (N=3 animals), then log2 transformed. Error bars represent +/− SEM values for each group. Statistical significance of each gene was computed using a one sample t-test of the log2 transformed ratio values relative to 0 (see Materials and Methods section). * represents P = 0.01, ** represents P < 0.01.

