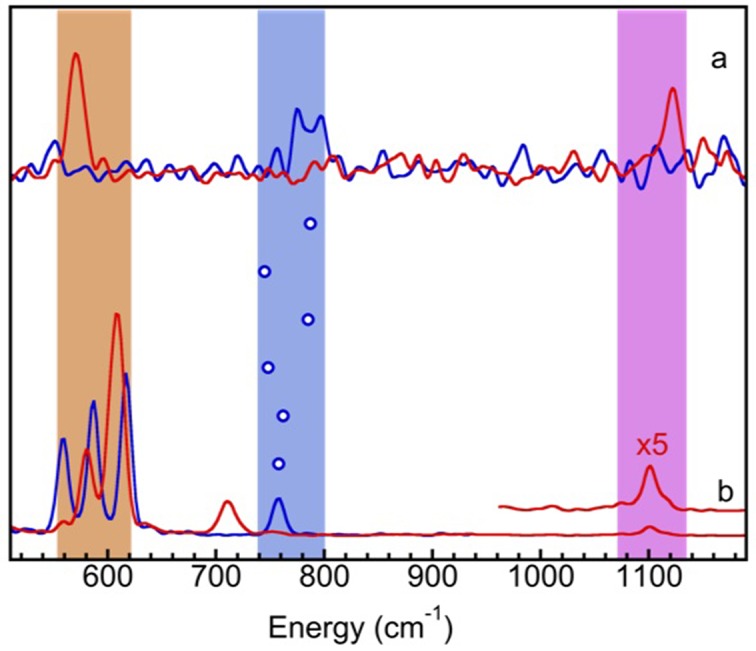
Figure 5.

NRVS observed PVDOS for (a) [FeH6] (blue)/[FeD6] (red); (b) NiHFe (blue)/NiDFe (red) model complexes. The blue circles indicate the Fe–H-related bending-mode centroids for (from top down) FeH6, HFeCO, HFeN2, FeHFe, NiH*FeX and NiHFe, while the shaded areas are for Fe–D-related bending (orange), Fe–H-related bending (blue) and Fe–D-related stretching (purple).
