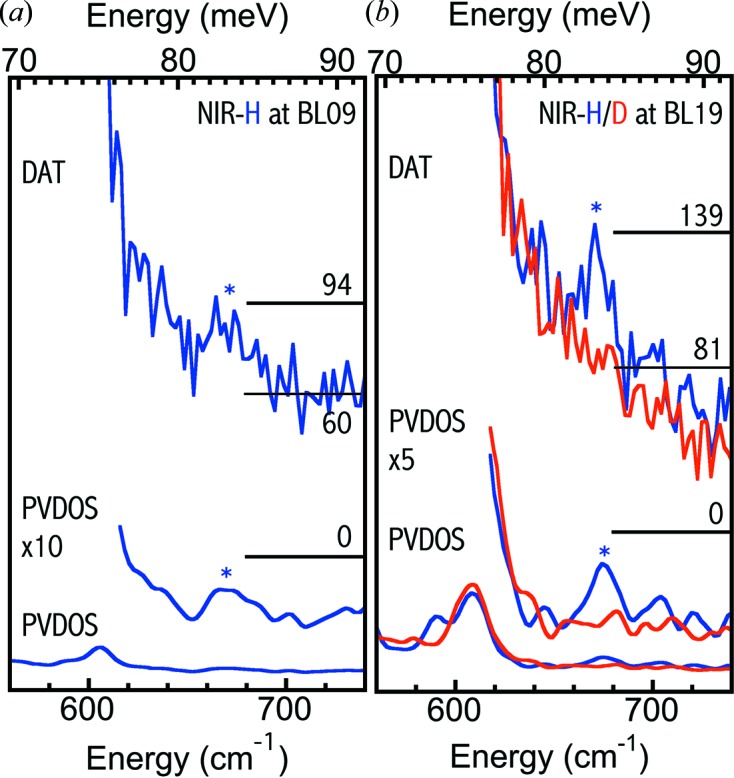
Figure 6.

(a) One set (680 s/p) of raw NRVS (top) and PVDOS [bottom and middle (×10)] for NiR-H (blue) measured at BL09XU. (b) One set (480 s/p) of raw NRVS (top) and the PVDOS [bottom and middle (×10)] for NiR-H/D (blue/red) obtained at BL19LXU. Note that the NiR-D raw NRVS has been rescaled in order to match the NiR-H baseline (due to different measurement times).
