Figure 9.

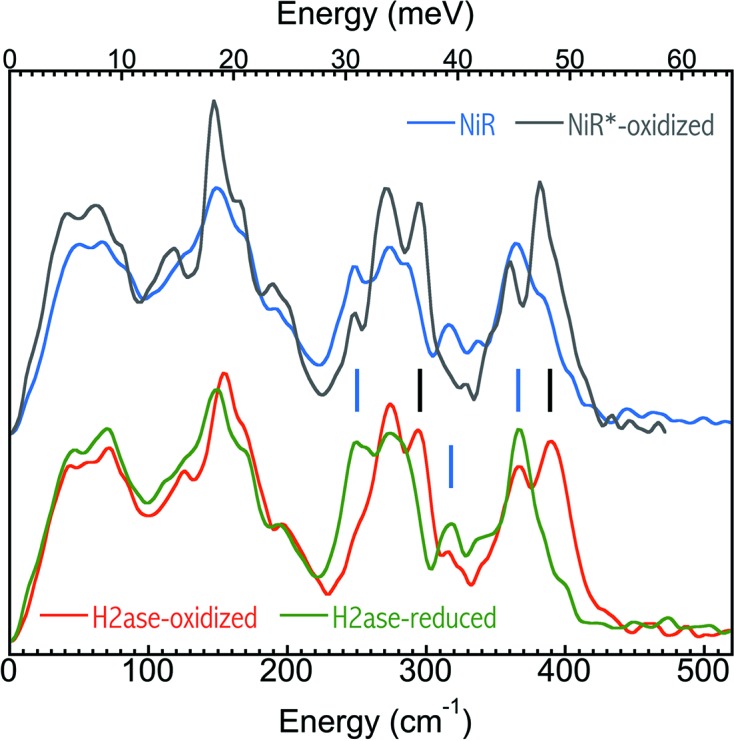
The first two-scan averaged NRVS spectra for a good Ni–R sample (light blue) and a bad (unexpectedly oxidized) Ni–R sample versus the established NRVS spectra for the oxidized (red) and reduced (green) DvMF H2ase (Kamali et al., 2013 ▸).

The first two-scan averaged NRVS spectra for a good Ni–R sample (light blue) and a bad (unexpectedly oxidized) Ni–R sample versus the established NRVS spectra for the oxidized (red) and reduced (green) DvMF H2ase (Kamali et al., 2013 ▸).