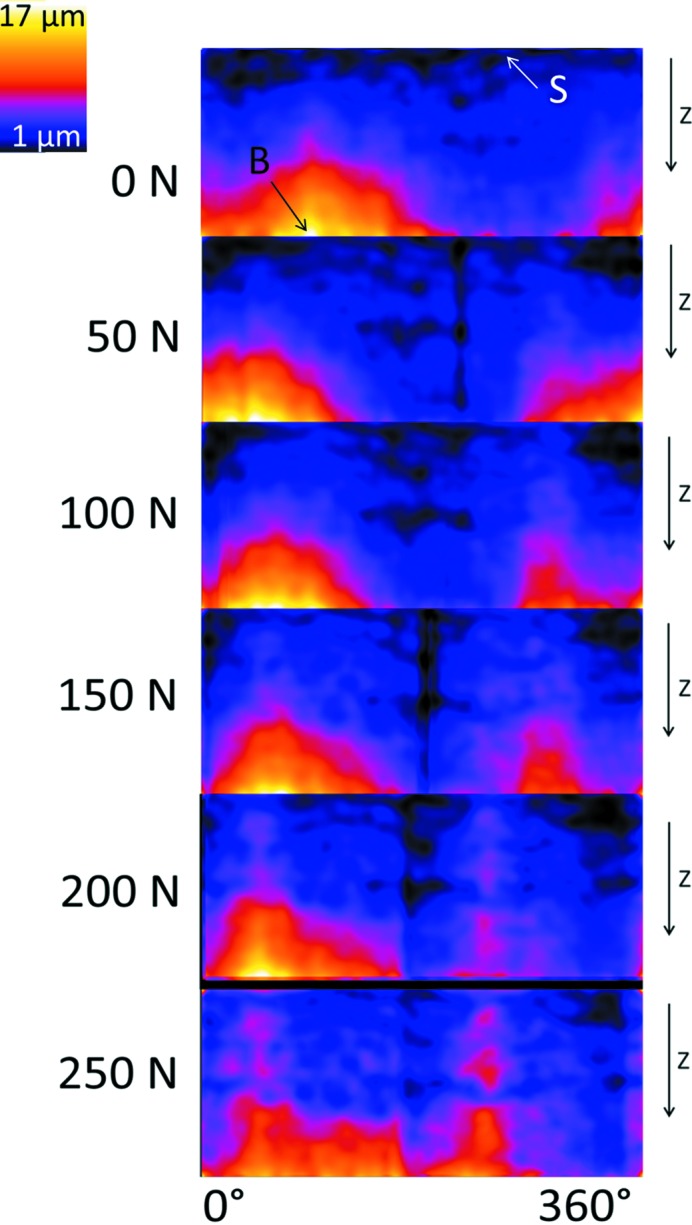
Figure 6.

Sequence of cylindrical projection maps showing the local microgap at the IAC at each force level (the average of five microgap maps out of ten scans). Calculation of these maps was performed according to Zabler et al. (2012 ▸), bright values show larger and dark values a thinner microgap. Orientation is along the implant axis; for better understanding see Fig. 2 ▸. For a better understanding we calculate the exact gap size at two characteristic points (point B, 17 µm gap size; point S, 1 µm gap size; the error for the gap size is ±2 µm). At The sample was a two-piece implant Astra OsseoSpeed TX (Dentsply, Germany).
