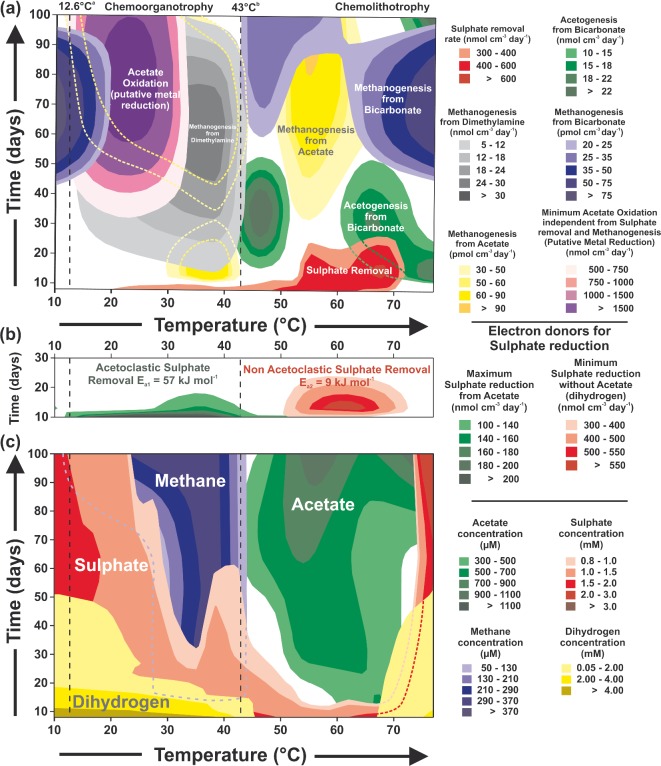
Figure 1.
Effect of temperature and incubation time on sediment slurries (∼45 μM H2). (a) Specific metabolic activities (very low metabolic rates are not shown). Yellow dashed lines show acetoclastic methanogenic rates when overlaid by other activities. Green dashed lines show rates of autotrophic acetogenesis. (b) Putative substrates for sulphate reduction. (c) Main metabolic substrates and products. Blue dashed lines represent methane concentrations when overlaid by other compounds. Red dashed lines represent sulphate concentrations. aAnnual average in situ temperature. bTemperature at which at least 50% of sulphate reduction was hydrogenotrophic.

