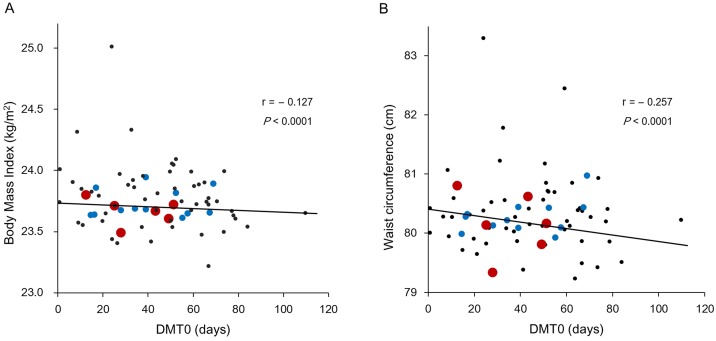
Fig 3. Correlation between body mass index (A) and waist circumference (B) with the number of days with mean temperature < 0°C (DMT0) based on 71 observation areas.
Red dot: areas with more than 5,000 subjects; blue dot: areas with 1,000–5,000 subjects; black dot: areas with less than 1,000 subjects.

