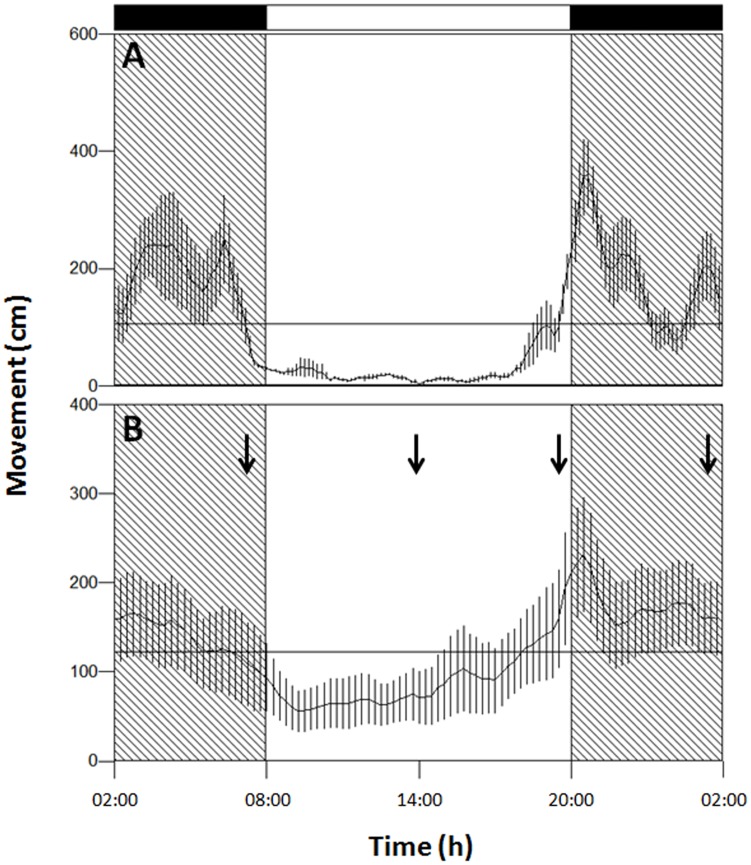
Fig 1. Waveform analysis.
Waveform (24 h) analysis throughout the 10 days of experiment for a representative lobster (A) and averaged for the 14 lobsters used during the study (B). Activity is reported as displacement (cm) out of the burrow. Black and white bars represent darkness and light hours, respectively. Shadowed areas represent scotophase. Vertical lines represent the standard error of the mean and the horizontal line represents the MESOR. Arrows in B stay for the sampling points at which eyestalk were dissected for the RT-qPCR experiment.

