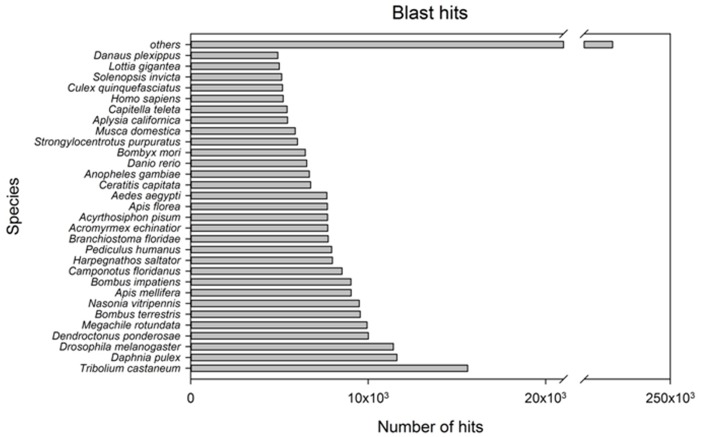
Fig 2. Species distribution of annotated transcripts of the merged transcriptome (NEP-comb).
The species distribution of the annotated hits of transcripts against the NCBI non-redundant protein sequence database (E-value cutoff to 10−6). Horizontal bars depict the number of hits for each one of the species. Only 30 species in order of number of annotated hits were presented, while the hits of all the other species are summed into the bar “others”.

